 {height=400px}
Hello Beyond,
Thanks for having me do a front-end audit of ADR.
My lens for frontend performance work on consumer-facing sites like ADR is usually the Core Web Vitals. This is partly because they’re an SEO ranking factor, which of course we’re trying to improve, but also because they’re just a good list of perf metrics that make sense.
As a quick recap, the Core Web Vitals are:
Overall, my impressions are:
So, my recommended plan is to quickly do the high benefit, low cost work and fix the handful of severe issues on “deeper in the funnel” pages.
I set up a test harness to test most of the various things I recommended in
this report. I’ll be citing these results again at the end, but I’d like to
direct your attention to the final
optimized line,
which combines all of the optimizations at once: a 42 percent improvement in
LCP!
| Variant | LCP (ms) | FCP (ms) | TBT (ms) | LCP Change |
|---|---|---|---|---|
| base | 2536 | 2536 | 9.5 | – |
| no-bbb-logo | 2345 | 2345 | 1 | -191ms (-7.5%) |
| no-optimizely | 1953 | 1822 | 0 | -583ms (-23%) |
| webp-images | 2240 | 2240 | 3 | -296ms (-12%) |
| preload-hero | 2380 | 2380 | 2.5 | -156ms (-6%) |
| optimized-images | 2175 | 2175 | 0 | -361ms (-14%) |
| lazy-loading | 1894 | 1894 | 0 | -642ms (-25%) |
| no-third-party-js | 1844 | 1013 | 0 | -692ms (-27%) |
| no-webfonts | 2503 | 2503 | 1 | -33ms (-1%) |
| critical-css | 2546 | 2546 | 5 | +10ms (0%) |
| optimized | 1462 | 998 | 0 | -1074ms (-42%) |
We can measure progress with the following goals:
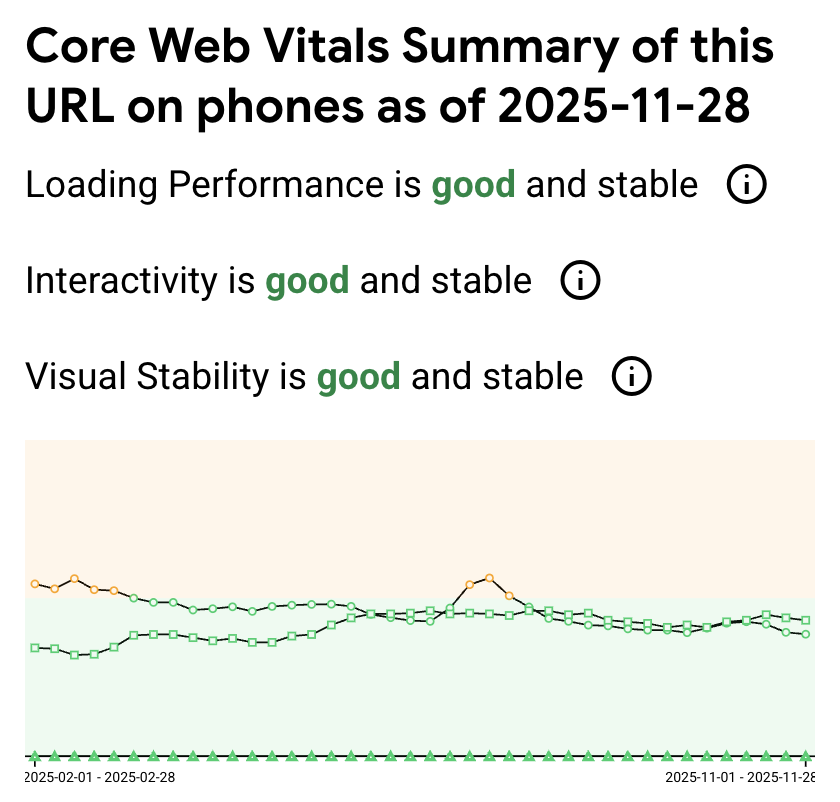
I use CruxVis, Google’s public dataset of Core Web Vitals, collected by billions of Chrome browsers all phoning home (yay!). I generally trust this data the most, because it’s the widest dataset, collected across the widest possible set of users.
The report for the homepage shows that LCP and INP are fine but “borderline”.
{height=400px}
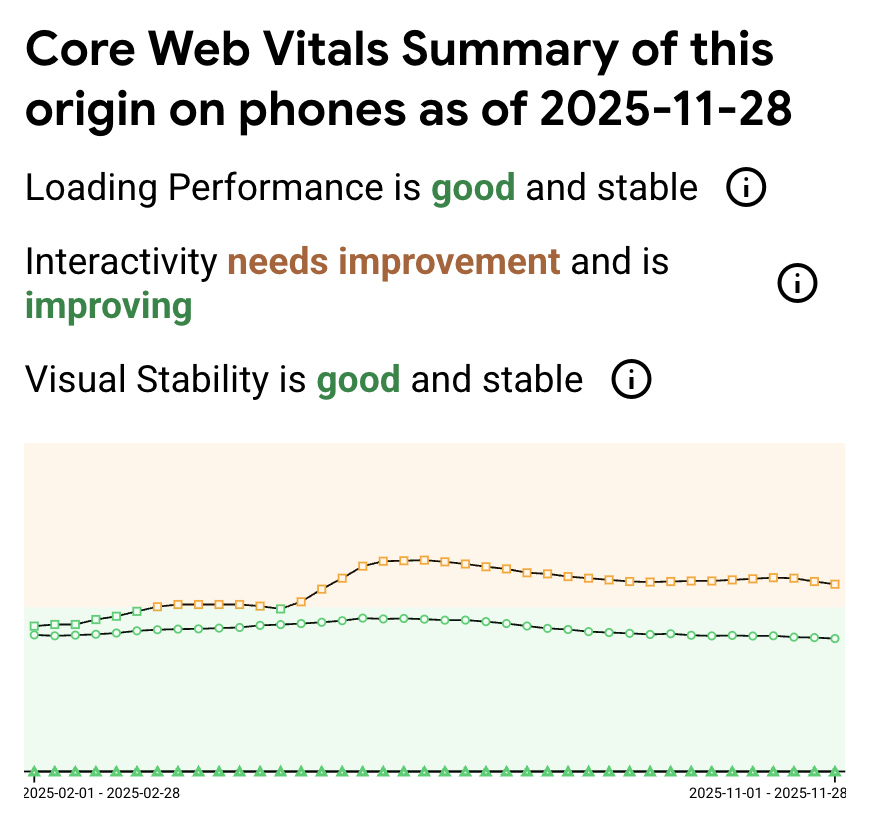
The report for the entire origin shows higher (yellow) INP, which of course means some page(s) other than the homepage are suffering from poor INP.
 {height=400px}
For more, let’s look at our own Datadog RUM information. Why are we getting higher INPs? On what pages?
Let’s move on to what I think specifically should be changed.
I tested a large number of these recommendations using my own custom test benchmark setup. Essentially I created a copy of ADR locally, used toxiproxy to replicate production network conditions, and then created a baseline whose performance more or less matches prod. Then, I can apply variants (versions of the suggestions I make below) and compare them to the baseline.
Code for the benchmark project is here.
As you’re probably aware, script tags with an external src attribute have a big impact on performance, because they block the main HTML parser until they are downloaded and completely executed.
You currently have the following script tag on the homepage:
<script src="https://seal-chicago.bbb.org/inc/legacy.js" type="text/javascript"></script>
This adds the following steps to the critical path:
I’m a bit limited in my testing because I’m on the other side of the ocean from the US, so my latency is artificially high due to the extra ~200ms to get across the ocean, but this is easily ~100-150ms.
It’s also a critical single point of failure. If bbb.org “browns out” and suddenly gets very slow, you would end up seeing your own site’s performance impacted.
In my local benchmark, removing the BBB logo completely reduced LCP by 200ms or 7.5%:
| Variant | LCP (ms) | FCP (ms) | TBT (ms) | LCP Change |
|---|---|---|---|---|
| base | 2536 | 2536 | 9.5 | – |
| no-bbb-logo | 2345 | 2345 | 1 | -191ms (-7.5%) |
Your alternatives are:
async or
defer - I’m not
familiar enough with how their snippet works to know if this is possible.
Both would equally solve the performance and reliability/SPOF issue.
I understand why people use third-party A/B testing frameworks. However, they all have a fundamental performance flaw:
They have to hide the site until their JavaScript loads and executes and applies any variation.
This inevitably delays page load because now the 3rd party’s domain, JS download and JS execution must be on the critical path.
In my experience, however, most teams are simply not aware of the cost of these tools and end up leaving them installed without actually actively testing any variations (or they’re still testing old variations whose impact was obvious long ago).
I recommend disabling Optimizely if it is not in active use.
Removing optimizely produced one of the largest improvements in LCP that I saw through my entire benchmark test:
| Variant | LCP (ms) | FCP (ms) | TBT (ms) | LCP Change |
|---|---|---|---|---|
| base | 2536 | 2536 | 9.5 | – |
| no-optimizely | 1953 | 1822 | 0 | -583ms (-23%) |
The homepage features significant amounts of image weight: 5.5mb of the total 8.4MB on the wire is images alone. Two of these are jpegs (1.5mb), the remainder are PNGs.
I don’t see a reason why we can’t get total image weight below 1MB using those two techniques.
The first part, just using the optimal codec, is called “Polish” on your Cloudflare zone. You can flip this on in Speed -> Settings -> Image Optimizations -> Polish. I use “lossy” because IMO the burden of proof for requiring “lossless” is on the designer… flip it, and if they didn’t notice, you didn’t need lossless compression.
In my own local testing, converting all images to webP at quality 60 reduced total image payload size by 90% by itself, so I know it’s possible.
Simply uploading the main header image (3MB png) to Cloudflare and serving it from there compressed the image from 3MB to 236kb. Then, if we let Cloudflare do transformation/image format negotiation on its own, it will use the AVIF format, further reducing size to 67kb. So that’s a reduction of 97%!
This isn’t limited to the PNGs. The “annemie-thumbnail” jpg, originally 970kb, gets compressed to 143kb on Cloudflare, but the AVIF version is just 97.9kb.
Second, on the same page, we can enable transformations. Enabling transformations for a Cloudflare zone is an easy flip of a switch. Once you do that, we can dynamically do height and width changes.
Additionally, many of your images aren’t actually completely displayed. For example, it’ll be a 16:9 image and you’ll only display a square crop of it, hiding the overflow. Additionally, many images are served over-resolution: you’ll serve a 1000px+ image at 450px.
The annemie thumbnail from earlier has both issues. Because the max width of the content column is set in CSS and this image is displayed in a half-column, its maximum width/height is 450px. You can change that image dynamically to that height/width like this:
https://imagedelivery.net/wvR-Z9aLpqnVxZGaCe4qLg/37cea30d-13ce-4fec-e3d9-b868603a3600/w=450,h=450
There are additional parameters for centering/zoom etc if needed. This URL serves a 13KB AVIF, down 98.5% from the original.
In my testing, optimizing images reduced LCP by 15%.
| Variant | LCP (ms) | FCP (ms) | TBT (ms) | LCP Change |
|---|---|---|---|---|
| base | 2536 | 2536 | 9.5 | – |
| optimized-images | 2175 | 2175 | 0 | -361ms (-14%) |
The over-resolution image problem is particularly bad on mobile. In a portrait orientation, the screen width itself isn’t even over 500px, and yet you’re serving a 750px wide hero image!
After Polish is on, I would take a look at any image that still is over ~100kb and use dynamic variants on it to transform it to a smaller width.
There are ~30-40 images on the homepage. There is only one that’s really important (both for the user, but also for LCP): that “annemie” hero image.
By default, browsers discover images only after parsing the HTML and building
the
render tree. Even then, they must prioritize dozens of resources competing for
bandwidth. The
fetchpriority="high"
attribute tells the browser: “This image matters more than others—start
downloading it immediately.”
Without this hint, the browser treats all images equally and may delay your
hero image while it fetches less important resources. With
fetchpriority="high", the browser elevates the image’s network priority, often starting the
download before it would otherwise.
Usage is simple:
<img src="hero.jpg" fetchpriority="high" alt="...">
In my testing, doing this by itself reduced LCP by 6%:
| Variant | LCP (ms) | FCP (ms) | TBT (ms) | LCP Change |
|---|---|---|---|---|
| base | 2536 | 2536 | 9.5 | – |
| fetchpriority-hero | 2380 | 2380 | 2.5 | -156ms (-6%) |
When I was going through the network data, I noticed every image had a
cf-cache-status
header value of
DYNAMIC, which means
it’s not being HTTP cached at all.
That’s less than ideal because what it means is that the image is being served directly from the origin, aka your Rails app. This is adding additional latency because if it was cache status hit, that means that it would be served directly from the Cloudflare server that’s closest to me, rather than having to go all the way to your origin. I’m in Japan, but even in the US, this is shaving off 50-75 milliseconds for a cache hit. And it also takes load off of your server as a little added bonus.
Since image formats are usually cached by default, I think what’s happening here is the set-cookie headers I’m seeing attached to every image response:
set-cookie
AWSALBTG=lCXVUgeWYMwRjs1zj1CaLNOPeM5KR0B07dJstHDZE80BaRwiSpg0F0FFhT8iZzMD7MCRh9anMrldCSVDF9a3hgZMabdIsFgfuOwq4quX1aSr2Vj8w0w90gqKJBxmhe11TZwKLa66IoPp82gBs5i8/ynIfRSV3ZtVhJ7eE+IeTVGXsrWvbvk=; Expires=Mon, 15 Dec 2025 03:55:51 GMT; Path=/
set-cookie
AWSALBTGCORS=lCXVUgeWYMwRjs1zj1CaLNOPeM5KR0B07dJstHDZE80BaRwiSpg0F0FFhT8iZzMD7MCRh9anMrldCSVDF9a3hgZMabdIsFgfuOwq4quX1aSr2Vj8w0w90gqKJBxmhe11TZwKLa66IoPp82gBs5i8/ynIfRSV3ZtVhJ7eE+IeTVGXsrWvbvk=; Expires=Mon, 15 Dec 2025 03:55:51 GMT; Path=/; SameSite=None; Secure
set-cookie
AWSALB=QKKI0qOTJmeDLTY9nwabcyjTw8V1m31DE+fXQrPMX1eBRQaVqhj9OPJTLk4byWGmCE0llXdBbL9QsTURJ39PboiEcxQ+kPfgJghrQhb1luSSRZsyNoHRsYGSgWfn; Expires=Mon, 15 Dec 2025 03:55:51 GMT; Path=/
set-cookie
AWSALBCORS=QKKI0qOTJmeDLTY9nwabcyjTw8V1m31DE+fXQrPMX1eBRQaVqhj9OPJTLk4byWGmCE0llXdBbL9QsTURJ39PboiEcxQ+kPfgJghrQhb1luSSRZsyNoHRsYGSgWfn; Expires=Mon, 15 Dec 2025 03:55:51 GMT; Path=/; SameSite=None; Secure
This looks like Sticky Session headers for ALB. I don’t know why you’d have sticky sessions on anyway, so it’s potentially something that was turned on without a lot of thought and just needs to be flipped off?
You could also configure cloudflare to just strip Set-Cookie headers off of images, using a Cache or Transform rule.
The homepage has ~38 images. On my desktop, 10 of those are visible in the viewport initially. On mobile, that decreases to 5.
Lazy loading these days is incredibly easy. The
loading=lazy
attribute is supported by
94% of users, and since
it’s just progressive enhancement, there is no visible regression for users
who don’t support it.
The only downside that I would say exists is the potential for a “Flash of Unstyled Content”-like behavior as the image loads in when it appears in the viewport for the first time. There can also be layout shifts which, while they always existed, were previously less visible because they all happened during page load rather than later on after LCP.
You can apply loading=lazy to every image except the page hero. Applying this to the hero, even when the hero is visible, potentially slows down LCP:
“Don’t lazy-load images that are visible when the user first loads the page, especially LCP images.” - Google
Their data shows pages with lazy-loaded LCP images have a median 75th percentile LCP of 3,546ms vs 2,922ms for pages without. That’s about a 20% penalty.
In practice, I find that you can modify image_tag to always use lazy, and then use a special hero_image_tag helper that overrides the lazy attribute:
Rails.application.config.action_view.image_tag_options = { loading: "lazy" }

def hero_image_tag(source, options = {})
  image_tag(source, options.merge(loading: "eager", fetchpriority: "high"))
end
| Variant | LCP (ms) | FCP (ms) | TBT (ms) | LCP Change |
|---|---|---|---|---|
| base | 2536 | 2536 | 9.5 | – |
| lazy-loading | 1894 | 1894 | 0 | -642ms (-25%) |
Currently, you just have the mobile hero embedded as an img tag, like so:
<img alt="A picture of woman with dog" class="hero-mobile-position" src="/vite/assets/annemie-hero-mobile-DG67Ljhx.png" />
Images, by default, load whether or not they are visible. So, you end up downloading the mobile hero on both desktop and mobile, and vice versa for the desktop hero.
In 2025, you can use the picture and source elements. This will combine really nicely with Cloudflare’s transformations as well.
<picture>
<source
    media="(max-width: 767px)"
    srcset="https://imagedelivery.net/.../hero-mobile/w=450,format=auto">
<source
    media="(min-width: 768px)"
    srcset="https://imagedelivery.net/.../hero-desktop/w=1200,format=auto">
<img
    alt="A picture of woman with dog"
    src="https://imagedelivery.net/.../hero-desktop/w=1200,format=auto"
    fetchpriority="high">
</picture>
ADR makes 27 requests to 16 separate domains for third-party Javascript. We already discussed that Optimizely is, by far, the most important for LCP out of all of these. However, the easiest thing to do is to remove unused 3rd-party dependencies, so I just want to take a moment here to inventory all the Javascript on the homepage and make sure it’s all still at least used in theory:
| Script | Domain | Purpose |
|---|---|---|
| bat.js (x4) | bat.bing.com | Bing Ads conversion tracking |
| link-initialize.js | cdn.optimizely.com | Optimizely A/B testing |
| heap_config.js, heap.js | cdn.us.heap-api.com | Heap analytics |
| fbevents.js | connect.facebook.net | Facebook Pixel |
| (signals/config) | connect.facebook.net | Facebook Pixel config |
| retreaver.min.js | dist.routingapi.com | Retreaver call tracking |
| fs.js | edge.fullstory.com | FullStory session recording |
| pagead* | googleads.g.doubleclick.net | Google Ads conversion |
| modules.ce37dfc81afa6fcb.js | script.hotjar.com | Hotjar heatmaps/recordings |
| legacy.js | seal-chicago.bbb.org | BBB seal |
| (beacon.min.js) | static.cloudflareinsights.com | Cloudflare Web Analytics |
| hotjar-1347812.js | static.hotjar.com | Hotjar loader |
| main.js (x2) | widget.trustpilot.com | Trustpilot reviews widget |
| tp.widget.bootstrap.min.js | widget.trustpilot.com | Trustpilot bootstrap |
| datadog-rum.js | http://www.datadoghq-browser.com | Datadog RUM |
| gtag/js | http://www.googletagmanager.com | Google Tag Manager |
| gtm.js | http://www.googletagmanager.com | Google Tag Manager |
Let’s just delete anything not in active use.
Note that removing third-party JS beyond Optimizely had very little effect in my testing:
| Variant | LCP (ms) | FCP (ms) | TBT (ms) | LCP Change |
|---|---|---|---|---|
| base | 2536 | 2536 | 9.5 | – |
| no-optimizely | 1953 | 1822 | 0 | -583ms (-23%) |
| no-third-party-js | 1844 | 1013 | 0 | -692ms (-27%) |
“Inline critical CSS” or “remove unused CSS”. I feel like everyone’s aware of this one because, in theory, almost everyone could be doing slightly better on it, and so Lighthouse loves to harp on you about it.
It’s just not that important for you. You have just 93kb (on the wire) of CSS. Probably the most effective thing I’ve seen is to integrate PurgeCSS to just remove unused CSS, but the potential impact of bugs here is high (unstyled elements) and the payoff so low (see below).
| Variant | LCP (ms) | FCP (ms) | TBT (ms) | LCP Change |
|---|---|---|---|---|
| base | 2536 | 2536 | 9.5 | – |
| critical-css | 2546 | 2546 | 5 | +10ms (0%) |
This for URLs like /free-quote/ocp/aff/?/questionnaire/*
I noticed this in Datadog - you can simply look at all pages which have an INP above 200ms and start looking at what was happening during their INP event.
What bubbled to the top was that a lot of the questionnaire pages had moderately high (100-300ms) INPs. Not slow, but very frequent.
All of these pages have onsubmit handlers for the main form (e.g.: user clicks “less than $20,000” on the debt-amount) step which are taking long amounts of time (>200ms) and thus causing high INP.
INP measures the delay between a user interaction (click, tap, keypress) and the browser painting the next frame showing visual feedback. When a user clicks a form option, the browser must execute any attached JavaScript handlers before it can update the screen. If your onsubmit handler takes 250ms to run, the user sees nothing happen for 250ms—the button doesn’t change, no loading spinner appears, the form just feels frozen.
The 200ms threshold exists because, according to Google at least, that’s roughly the limit of what feels “instant” to humans. Beyond that, users perceive lag and the experience feels sluggish.
This one was trivial to reproduce because you can repro it on the first step of the funnel form. Just open up DevTools with the performance tab running when you click the form element. You’ll need to use DevTools “CPU slowdown” mode to simulate being on a low/midspec Android device rather than your $3000 Mac M3 Max!
What I saw in the flamegraph was surprising: it’s all heap.js.
I’m skeptical that you can figure out a way to optimize exactly what heap is doing here. First of all, it’s all minimized, so it’s pretty hard to follow. I would say this is similar to your other 3rd party JS: are you actually using this feature of Heap? Is it worth potentially getting a “yellow” score on your origin for INP?
As far as I can see, this Heap analytics handler is the only INP issue on the entire site.
/guided/* is one of the slowest loading pages on ADR. For all pages which have an LCP above 2.5 seconds, it has the second most-frequent number of slow loads.
The cause is simple - since almost every page has the exact same frontend experience, the backend is what’s making the difference here. The GuidedEnrollmentsController takes ~1.25 seconds at p75 due to a high (~12-15) Salesforce call count.
Reducing the call count here would reduce LCP for this unusually slow page.