Hello Huntress team,
Thanks again for bringing me on to look at your setup. Overall, I think this is an app that’s very healthy from a web latency standpoint, but shows room for improvement as far as background job latency and overall provisioning. There are big opportunities to improve both the overall cost of compute as well as on-time performance for backgrounded work.
The load on the app overall is quite high. You’re doing around 20,000 requests per second on web and 10,000 jobs per second on Sidekiq. However, the latency on web in particular is quite low. Your p99 is something like 150ms, which is easily 10-20x lower than most Rails apps I end up working with. That low service time means you’re not drowning under a ton of concurrent requests.
Background job performance is a bit rougher. You have about 40 queues in the
app, but
monitors on only 15.
Queue latencies can vary across a week, and SLA queues are exceeding their latencies on a regular basis. As an
example,
biz_platform_sla_30s
saw 2 minute latencies ~3 times in the past 7 days.
In addition, you are provisioning substantial amounts of compute for both web and background. Background jobs hover around 4-5k processes per day. We could make several changes which might make substantial dents in this number (or at least in the resources required for each process).
I view retainer engagements as a long-term focus on a particular set of metrics. I said I would propose a set of metrics to be our yardsticks for this effort. Here they are:
c6g.8xlarge nodes
most of the time. I don’t know how you pay for these, but those are $9,500
each on-demand, so if this was all on-demand sticker price we’d be talking
about a ~$950,000 per year reduction.
These three goals would all represent big steps forward for you operationally.
The c6g.8xlarge has 32 vCPU and 64GB of RAM. The on-demand sticker price is $9,500 annually. It’s from the 2nd generation of Graviton CPUs, released 5 years ago in early 2020.
I’ve always known that older instance types were slower. Single-thread CPU speeds improve every year. But how much?
Ruby core actually
maintains a set of standard Ruby benchmarks, which is intended to monitor Ruby perf (particularly for YJIT). Most of
these are highly CPU-focused, but several are full-up Rails responses, like
the discourse,
railsbench, and
shipit benchmarks.
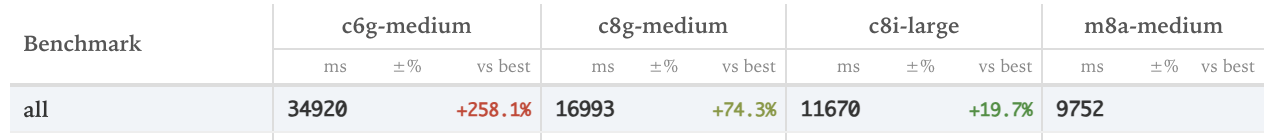
Since we live on the brave new frontier of 2025, I vibe-coded up a benchmark runner that runs rubybench across several different instance types.
You can view the results online here. The overall differences are pretty stark:
I think these results are a good guide to what is possible, but I’m not 100% confident they will replicate exactly in production. That is to say, I don’t think switching from c6g instances to c8a instances will improve your response times by 2.5x. I do think they show a substantial improvement is possible.
That means that if we can reduce service times of Sidekiq jobs and web responses in half, we’ll see a corresponding drop in CPU use (and therefore be able to provision fewer of them), mediated by the portion of our workload which actually uses CPU.
If we put these all in a table, and consider the performance on the
shipit benchmark as
our standard (it’s the most realistic/representative of a real Rails
response), we get the following:
| API Name | Shipit Benchmark vs baseline (x faster) | On Demand (annual) | Linux Spot Minimum cost (annual) | Cost/Perf |
|---|---|---|---|---|
| c6g | 1 | $9,530.88 | $3,518.02 | $9530.88 |
| c7g | 1.02 | $10,161.60 | $3,643.28 | $9962.35 |
| c8g | 1.92 | $11,179.16 | $3,744.02 | $5822.48 |
| c7i | 2.08 | $12,509.20 | $5,145.62 | $6014.04 |
| c8i | 2.45 | $13,134.39 | $6,704.03 | $5360.98 |
| c7a | 2.85 | $14,386.02 | $6,011.99 | $5047.73 |
| c8a | 3.37 | $15,105.04 | $6,661.98 | $4482.21 |
Probably one of the main reasons to distrust this benchmark is that the database and the Rails instance are run on the same instance, which means performance increases get overstated as the database and the app are getting faster at the same time, unlike your prod setup. However, I think the difference between c6g and c7g and the other instances is undeniable.
I think that changing to c8g.8xlarge could result in needing ~25% fewer nodes as response times and job execution times decrease.
I know you’re moving to Azure soon, however I include the AWS here because:
I am working on an Azure recommendation and will update you when I have it. Azure is a lot harder to work with than AWS, so it’s taking me longer to get the bench working than expected.
I noticed that the Sidekiq core requests are inconsistent across deployments.
Some are set to
cpu: 750m, others to
cpu: 2, etc.
There’s no good reason for a CPU request on an auto-scaled Ruby service to be anything other than one core. The autoscaler is responsible for ensuring the number of pods keeps CPU usage trending between 50-90%. We should never see sustained CPU usage above one core per process because Ruby’s Global VM Lock (GVL) effectively limits a single Ruby process to one CPU core at a time.
For production processes like Sidekiq or Puma, I don’t see any reason to
provision requests above
1 (or
1000m). The limit
could potentially be set higher. There are edge cases where Ruby containers
might use more than one core, such as when untarring source code during CI.
However, I can’t think of a production scenario where something inside your
Docker container would consistently use more than one CPU core. There might be
an argument for a higher limit, but requests should be set to one.
In production, you are currently running a resource configuration of:
resources:
limits:
    cpu: 1500m
    memory: 4G
requests:
    cpu: 1500m
    memory: 512M
Based on the memory usage here, that looks like it’s running just a single Puma worker process per pod. I want to change that also as a separate recommendation, but I’ll just concentrate on the CPU allocation per worker here.
For the same reasons as I enumerated above re: Sidekiq, you should be setting this to cpu: 1000m.
For Puma, there’s going to be a slight variation here where we should really be setting this to 1000 per Puma process. Like I said, right now that’s one, so it should just be set to a thousand. However, in the future when I tell you to add more processes per pod, this number should be scaled in proportion to the number of processes. So as an example, my recommendation is gonna be to put sixteen processes into a pod, so the CPU should say 16000.
The vast majority of your Sidekiq queues are configured to run single-threaded. I understand why. Big organizations typically start to prioritize thread safety over cost. Notably, MDE, which is a quite a big queue that runs quite a lot of pods, runs with three threads. Thus, it’s unclear to me what you really think about the thread safety of your application.
However, I think it might be helpful to quantify what is really on the table here in terms of possible throughput improvement and cost reduction.
Of course, this is going to be workload dependent. If a worker spends 50% of its time waiting on I/O, even when it’s fully utilized (all processor threads are busy) you will only use 50% of available CPU. What adding additional concurrency does for us is really just allow us to more efficiently utilize a single CPU while keeping memory usage also low.
So we have a couple of levers that we can pull to ensure that we’re fully utilizing all the CPU that we’re allocating here: increase thread count in an attempt to fully utilize a 1 core allocation, or decrease CPU allocation for each process.
When a workload does a lot of IO, like fifty percent of its time or more, tuning Sidekiq to five to ten threads can improve throughput by fifty to a hundred percent. So effectively doubling the amount of jobs per we can get out of the same CPU. We can also do this, of course, by adding an additional process per core, or in your case, more likely you would just decrease the CPU allocation for each process to half of a core, 512 millicores.
However, the Sidekiq process with additional threads will probably increase memory usage by twenty-five to thirty percent. However, doubling the number of processes just doubles the amount of memory you’re going to use. This is why we use threads at all to begin with: they are more memory efficient.
| Approach | Throughput Improvement | Memory Impact |
|---|---|---|
| Increase threads (5-10) | +100% | +25-30% |
| Halve CPU per process (to 512m) | +100% | +100% |
Since the introduction of Ruby 3.2, we actually have the ability to measure what percent of a workload is IO or CPU blocked in production. We have a gem for this that we’ve installed at a lot of other clients. The underlying instrumentation here was written by Shopify and Ruby Core. And say when our Sidekiq jobs do work, what percent of their time is spent waiting on IO. And that would allow you to make an intelligent decision as to how many CPU cores per process you would want to use, or how many threads you’d want to use.
So, my process recommendation for this is:
Here’s an overview of current concurrency/memory/cpu/queues:
| Service | Concurrency | Memory (MB) | CPU Units | Queues |
|---|---|---|---|---|
| rio-sidekiq-arm | 1 | 4098 | 1280 | rio_windows_analysis, rio_analysis |
| rio-darwin-sidekiq-arm | 1 | 4098 | 1280 | rio_darwin_analysis |
| rio-linux-sidekiq-arm | 1 | 4098 | 1280 | rio_linux_analysis |
| rio-historical-sidekiq-arm | 1 | 4098 | 1280 | rio_historical |
| surveys-sidekiq-arm | 1 | 4098 | 1024 | fast_surveys, surveys |
| survey-deletions-sidekiq-arm | 1 | 4098 | 1024 | survey_deletions |
| general-sidekiq-arm | 1 | 10240 | 768 | mailer, high, low, default, org_unreference |
| signals-sidekiq-arm | 1 | 10240 | 768 | signals, signals_retry, signals_expedited, signals_triage, signals_noise, signals_hunting, signals_experimental |
| m365-sidekiq-arm | 3 | 4096 | 768 | m365 |
| m365-fetch-sidekiq-arm | 3 | 4096 | 768 | m365_fetch, m365 |
| m365-outbound-phishing-sidekiq-arm | 3 | 4096 | 768 | m365_outbound_phishing |
| m365-low-sidekiq-arm | 3 | 4096 | 768 | m365_low, m365 |
| agent-health-sidekiq-arm | 3 | 4096 | 768 | agent_health |
| siem-sidekiq-arm | 1 | 3072 (soft 2048) | 1536 | siem |
| siem-processing-sidekiq-arm | 1 | 3072 (soft 2048) | 1536 | siem_processing |
| siem-powershell-sidekiq-arm | 1 | 4096 | 1024 | siem_powershell_scheduled, siem_powershell, siem_low |
| analysis-sidekiq-arm | 1 | 4096 (soft 2048) | 2048 | analysis |
| mde-sidekiq-arm | 3 | 4096 (soft 2048) | 768 | mde_alerts, mde_default, mde_low |
| business-sidekiq-arm | 1 | 10240 | 768 | biz_platform_30s, biz_platform_1h, biz_platform_24h |
Looking at
container.memory.usage
in Datadog for all
portal* kube
deployments, memory usage in the past week has been less than 2gb
maximum (across all pods!) on all deployments except sidekiq-general,
which appears to have a memory bloat issue (average is ~1.5GB but max is
~8gb). The average of all deployments is far below 2gb.
For portal-web the averages are even lower (700mb), though maximums can also temporarily explode to ~8gb+.
The big ratio I’m keeping in mind is that your fleet is provisioned for the
c series ratio of
1vcpu to 2gb of RAM. Deviating from that ratio either makes binpacking really
difficult or you end up having to provision lots of unnecessary instances
whose cpu or memory won’t be used.
Your restart counts are fairly low across the infra.
OOM kills by themselves aren’t great. However, it’s definitely hard to recommend provisioning ~5x more instances than necessary to avoid them, as well.
The steps I recommend are:
sidekiq-high-memory
worker class.
sidekiq-memory_logger
but for rack. It’s harder to “quarantine” web workloads so instead we’ll
have to fix any high-memory-use endpoints one by one.
That should all allow you to greatly reduce memory allocation and, finally, node count.
From what I can tell from memory usage, it looks like WEB_CONCURRENCY is set to 1 on all Puma pods. This is a classic SRE approach: “one process per pod.” But this advice doesn’t apply well to pre-forking web servers, which is Puma’s design.
The “one process per container” idea exists for clean process lifecycle management. Kubernetes can monitor a single process directly, restart it on failure, scale horizontally.
Puma is designed to work with a cluster of processes. A master process forks
multiple workers at startup. With the
preload_app! config
settings, the master loads the entire Rails app into memory before forking.
Copy-on-write (COW) means the forked workers share that memory with the master
until they write to it. 16 Puma workers don’t use 16x the memory of one
worker. They share application code, gem code, and, critically, file
descriptors (e.g. “port 3000”).
So, when using one process per pod, you’re already using far more memory per process on average than you would otherwise. But, there’s another huge benefit!
AWS ALB uses round-robin or least-connections across targets. It doesn’t know if an individual Puma worker inside a container is busy. If you have 16 containers with 1 worker each, the ALB picks a container and sends the request. If that worker is stuck on a slow request, your new request waits in the socket queue. It’s a “dumb” routing layer.
Puma in cluster mode handles this better. With 16 workers in a single
container, all 16 call
accept() on the same
listening socket. The kernel routes incoming connections to whichever worker
calls
accept() first,
which is always an idle worker. Automatic, kernel-level load balancing based
on actual availability.
Remember: queueing cannot occur unless all workers in a pod are busy. It’s really just statistically less likely that all 16 workers will be busy, even if traffic is 16x the one-process-per-pod case.
An M/M/n queue (n servers, one queue) has much lower wait times than n separate M/M/1 queues at the same utilization. Separate queues let requests pile up behind one slow server while others sit idle. A shared queue means no server is idle while work is waiting.
Run 16 Puma workers in a single container instead of 16 single-worker containers. You’ll get lower request queue times, better memory efficiency through COW, and more consistent latency.
The tradeoff on the other side here (why not 32? why not 64?) is twofold:
Shopify currently uses 32 core pods, as a comparison point.
This is, in my opinion, one of the biggest reasons to use a control plane like k8s in the first place: to let you treat compute nodes as cattle, not snowflakes.
It seems like you’re close to supporting this, but didn’t follow through on the effort?
Spot instances get a 2 minute termination warning. This is far, far longer than most timeouts in your system which are already important:
And of course, your instances can be interrupted at any time today by a deploy.
Spot workloads have gotten a lot more expensive in the last 2 years or so (thanks a bunch, AI), but they’re still considerably cheaper than on-demand. In my opinion, the 2-minute shutdown also just ends up enforcing good devops practice anyway: workloads should be idempotent and shut down promptly when asked.
I can’t really be sure what the cost cut here would be because it probably depends greatly on your existing AWS Savings Plans.
I see that you’ve started applying SLOs to a very small number of queues. That’s great!
However, every queue should have an SLO in the name. This is because all queues have implicit SLOs, even if they have never been written down anywhere.
Consider for any queue: what would happen if the queue latency on this queue was suddenly 7 days? Work would sit in the queue for an entire week before even being started. What would happen to the business? Would anyone notice? Would customers complain?
If the answer to any of those questions is “that would be really bad”, this queue has an SLO. You just haven’t written it down, and probably have no alerting or monitoring to page the right people during an incident, and have no way to review whether or not the provisioning is correct on a regular basis.
My general process recommendation here is:
siem becomes
siem-sla-30s, etc.
Two special values are often used as well: a value denoting “instant” SLA
(web-like: near zero latency), and a value denoting “no” SLA, like a
backfill queue. Probably for you that would be something like
sla-0s and
sla-backfill.
siem-sla-30s and
mailers-sla-30s
become sla-30s).
SLO queues have a number of benefits:
Your Sidekiq queue HPAs are currently set to scale on size rather than queue latency.
When I think about autoscalers, I think about “what is our quality of service?” What denotes the quality of the service that we’re providing? What metric, if it grows unchecked, would result in a worse quality of service for our customers?
Frequently with autoscalers, we end up playing the drunk under the streetlight, and end up autoscaling based on a 2nd or 3rd order metric that’s immediately available, rather than a metric that we don’t have.
What we really care about is latency. If your Sidekiq jobs suddenly spent twice as long in the queue, or if your web responses suddenly took twice as long, customers would notice.
My plan would be:
yabeda-sidekiq
and report queue latency to AWS and Datadog (via yabeda-datadog and
yabeda-cloudwatch).
Your Puma worker counts currently mostly sit on the minimum of the HPA. Those minimums are pretty high.
Since your current autoscaler behavior is set to requests per target, you don’t really have any idea what the quality of service is. That means you can’t scale down (or up, as the case may be, but I’m 99% certain you’re overprovisioned) because you don’t really know what your quality of service is.
Just like the Sidekiq situation, we have to:
Reporting queue latency with Rack usually works like this:
X-Request-Start
that contains the milliseconds since the UNIX epoch.
It seems like there is not a reverse proxy or nginx ingress controller in your current setup. We will need to add something like that, as ALB cannot add the necessary header. Azure can’t either, as the time is not one of the variables you can use when rewriting headers.
We’ll report this also via Yabeda. Yabeda, unfortunately, doesn’t have a rack-based middleware for reporting request queue time, but it would be trivial (10 lines) to implement our own.
Once that’s reported, we should do the same thing we do for Sidekiq queues: