Hey Recora,
Thanks so much again for bringing me on. Overall, I was impressed with the quality of the work already done on this application. I thought the engineering here has been done to a high standard. I was also happy to see that many of the concepts I teach in my books and courses were already in active use: SLO queues, using Ruby to sort/filter data instead of SQL, and more. In totality, my report here represents a kind of “polish step” or “step up” from an already high level of quality.
You mentioned to me that you would like to reduce the cost of your deployment, so most of my recommendations here are in that vein. I also have some points to make around overall “operational stability”, things that will improve the day-to-day stability and scalability of the app.
For the retainer’s 6-month engagement, I like to work through the lens of: what are some key things we track (as metrics) and improve over this 6 month period? For you, I think those are the following:
I’ve put my recommendations into these two categories.
within_5_minutes_high_io
queue for tonic
You have two jobs which both represent a high amount of time consumed for tonic but also do a ton of I/O:
ProcessWorkflowActionAIJob
is basically a frontend for an OpenAI, so no surprise, it takes 10-20
seconds to get responses back sometimes.
Plugins::PluginRunner
seems to make requests to
stedi often, which
can sometimes take 5-20 seconds. This job isn’t nearly as much I/O as the AI
job, but it’s still significant (and makes up a significant portion of time
consumed). This appears to only be for a subset of the plugins, not
all.
As I write this, you’ve reported 5 days worth of work in the last 14 days to
Sentry for the
within_5_minutes
queue. You’ve done ~6.5 days of work in total over all queues during
that time period. These two jobs represent about 3 days of work, or about 60%
of the wall time of this queue, or about half of your entire backend job load.
Both of these jobs spend a significant amount of time waiting on IO, but are
running on Sidekiq instances with
RAILS_MAX_THREADS
set to 5. Consider, as an example, a Sidekiq process who picks up 5
ProcessWorkflowActionAIJobs at the same time. It will then basically sit idle for 15 seconds while all
those requests complete. That’s not an efficient use of CPU resources.
Because these jobs are so high-IO and represent a huge proportion of your workload, I think it’s worth creating a new queue for them specifically and a new task type which will only consume this queue (similar to long_running).
That queue should be configured with RAILS_MAX_THREADS=25, which, in my experience and in synthetic benchmarks we’ve done, maximizes throughput for ~95%+ I/O wait workloads.
The approximate throughput increase can be calculated here using Amdahl’s Law. Ruby can only wait for I/O in parallel, so the only parallelizable portion of the workload is I/O wait. Let’s estimate the I/O wait percentage at 90% across these two jobs.
Given that information, we can compare the before/after throughput of RAILS_MAX_THREADS=5 and RAILS_MAX_THREADS=25.
Amdahl's Law: Speedup = 1 / ((1 - P) + P/N)

Where:
    P = parallelizable portion (I/O wait) = 0.90
    N = number of parallel threads

With 5 threads:
    Speedup = 1 / ((1 - 0.90) + 0.90/5)
                    = 1 / (0.10 + 0.18)
                    = 1 / 0.28
                    = 3.57x (theoretical max speedup over single-threaded)

With 25 threads:
    Speedup = 1 / ((1 - 0.90) + 0.90/25)
                    = 1 / (0.10 + 0.036)
                    = 1 / 0.136
                    = 7.35x (theoretical max speedup over single-threaded)

Relative improvement from 5 to 25 threads:
    7.35 / 3.57 = 2.06x throughput increase
So that’s great! We’ll be able to run half the number of tasks (for
this part of the Sidekiq workload) we needed to before this change.
That should be about a 25% reduction in the average task count for
tonic.
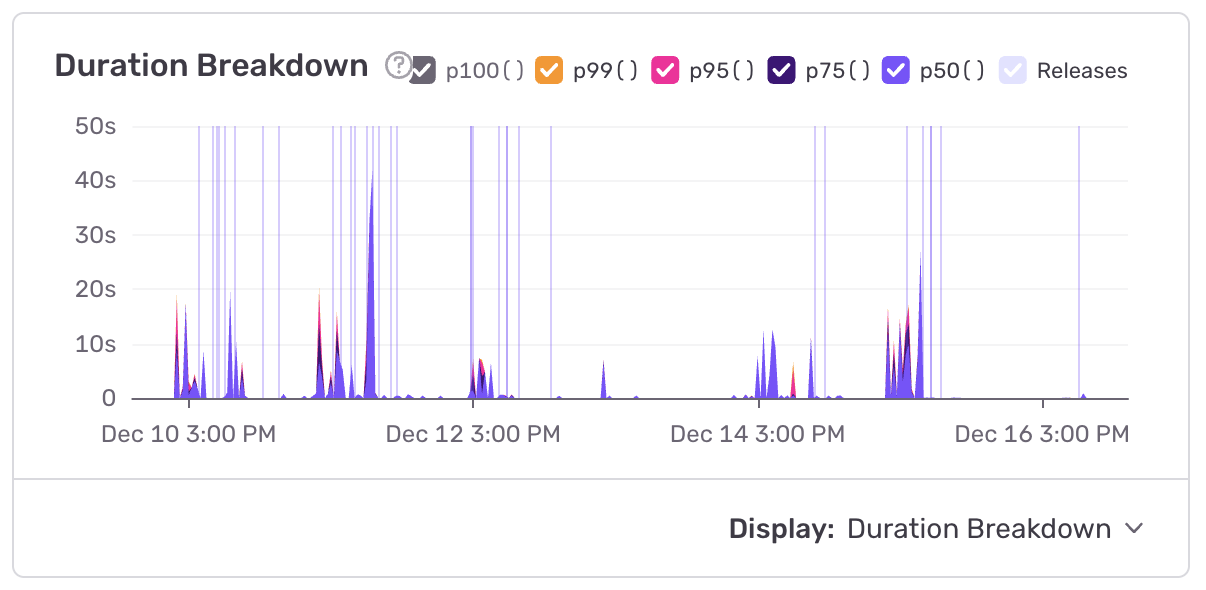
I usually look at the last 14 days of data, so this one showed up but then I realized you solved it.
This controller in
care is, far and
away, one of the most high-load endpoints on Care. That’s despite it having
~100x less requests per second than many of the other endpoints. It has one of
the highest p95s (17 seconds or so) of the entire app.
The root cause is a very slow query (Sentry calls it CARE-API-BD)
You solved this with
20251211000000_add_mailgun_id_index_to_member_communications.rb. Good work!
This is a high-load controller in Care. Reducing the latency here would reduce load on the service, letting us provision fewer tasks.
The average latency of this controller is ~2.5 seconds due to
repeated serial calls to
acuityscheduling.com
followed by an N+1 on the appointments table directly after:
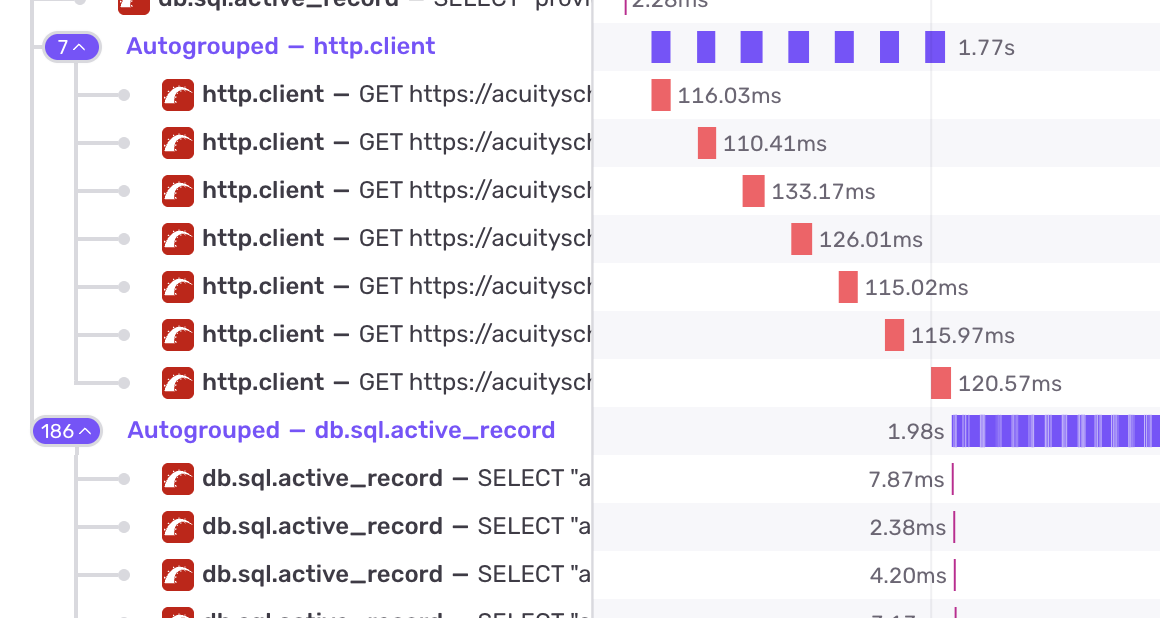
We’ll fix the N+1 by reproducing that in development and then adding a Prosopite test, then fixing the test.
For the I/O calls, I’d like to make those in parallel using an ad-hoc threadpool with concurrent-ruby.
# Today:
(start_date..end_date).collect do |date|
available_times = availability_on_date(
    calendar_id: calendar_id,
    appointment_type_id: appointment_type_id,
    date: date
)
# ...

# AI-written sketch of the future
futures = dates.map do |date|
    Concurrent::Future.execute(executor: thread_pool) do
    times = availability_on_date(
        calendar_id: calendar_id,
        appointment_type_id: appointment_type_id,
        date: date
    )
    [date, times]                                                                                                                                      end
end

results = {}
futures.each do |future|
    date, times = future.value!

    if times.nil?
    raise ::Acuity::SchedulingError,
        "Empty available times found for Calendar ID: #{calendar_id}, " \
        "Appointment Type ID: #{appointment_type_id}"
    end

    results[date] = times
end

results
end

private

def thread_pool
    @thread_pool ||= Concurrent::FixedThreadPool.new(
        5,  # max concurrent Acuity requests
        max_queue: 20,
        fallback_policy: :caller_runs
    )
    end
end
You currently have all web tasks set to 1 CPU and running Puma in single mode.
The “one process per container” idea exists for clean process lifecycle management. For example, Kubernetes can monitor a single process directly, restart it on failure, scale horizontally.
Puma is designed to work with a cluster of processes. A master process forks
multiple workers at startup. With the
preload_app! config
settings, the master loads the entire Rails app into memory before forking.
Copy-on-write (COW) means the forked workers share that memory with the master
until they write to it. 16 Puma workers don’t use 16x the memory of one
worker. They share application code, gem code, and, critically, file
descriptors (e.g. “port 3000”).
So, when using one process per task, you’re already using far more memory per process on average than you would otherwise.
But, there’s another huge benefit!
AWS ALB uses round-robin or least-connections across targets. It doesn’t know if an individual Puma worker inside a container is busy. If you have 16 containers with 1 worker each, the ALB picks a container and sends the request. If that worker is stuck on a slow request, your new request waits in the socket queue. It’s a “dumb” routing layer.
Puma in cluster mode handles this better. With 16 workers in a single
container, all 16 call
accept() on the same
listening socket. The kernel routes incoming connections to whichever worker
calls
accept() first,
which is always an idle worker. Automatic, kernel-level load balancing based
on actual availability.
Remember: queueing cannot occur unless all workers in a pod are busy. It’s really just statistically less likely that all 16 workers will be busy, even if traffic is 16x the one-process-per-pod case.
An M/M/n queue (n servers, one queue) has much lower wait times than n separate M/M/1 queues at the same utilization. Separate queues let requests pile up behind one slow server while others sit idle. A shared queue means no server is idle while work is waiting.
My recommendation is that you run 4 Puma workers in a single container instead of 4 single-worker containers. You’ll get lower request queue times, better memory efficiency through COW, and more consistent latency.
The tradeoff on the other side here (why not 32? why not 64?) is twofold:
For low-traffic environments, you should scale this worker count down. QA/test/staging can remain single process.
I noticed that care and tonic scale based on memory utilization. First of all, that’s a good way to guarantee that you always end up spending 35% more than absolutely necessary on memory cost, but secondly, scaling up based on memory usage doesn’t make a lot of sense, because memory utilization shouldn’t correlate with transactions per second.
You currently run all your SLO sidekiq queues through the same task type. This is, however, creating an overprovisioning problem.
The average queue latency of your “loose” SLO queues (5 minutes and up) is extremely low. This is not a good sign. We want the average time spent in the queue to be roughly ~50% of the queue’s SLO (while maintaining good SLO adherence!) so that utilization is maximized.
In order to meet your queue SLOs while maximizing utilization, I’d use three different types of tasks in ECS:
within_1_minute, within_5_minutes
but it should only autoscale based on the
within_1_minute
queue latency. This queue and task type will primarily attain a 99% SLO
through manual tuning of the minimum task count, because you can’t autoscale
fast enough to meet 1 minute SLOs.
within_5_minutes
and only autoscale if that queue latency exceeds 60 seconds.
within_1_hour and
within_24_hours.
This task type can scale to zero, and autoscale only when queue latencies
exceed 20 or 30 minutes.
Currently, you’re having to run this single task type at a high number of minimum dynos in order to meet the SLO of the 1 minute queue, but your workloads that don’t NEED that fast of a queue latency are executing far too quickly. Longer time spent in the queue allows higher utilization.
long_running task
type should scale to zero
This task type isn’t heavily used, and it’s SLO appears to be very loose. I would consider allowing it to scale to zero and scaling up when queue latency exceeds 30 seconds (as it does today). This would effectively lengthen the possible SLO of this queue to 30 seconds + ~5 minutes but it seems like the workload could handle that?
You’re currently on Postgres 15. Postgres major versions carry decent “free speed”. I would consider upgrading to Postgres 17. Postgres 18 has native UUIDv7 support (see later recommendations) but is not yet generally available on AWS, so you could consider waiting until then.
Read replicas are a pretty big luxury for this size of application. In general, I am not a huge fan of read replicas for applications where the primary database is not yet in the top ~2-3 largest RDS plans available. It is far easier (and cheaper) to scale vertically than horizontally.
I can see these are used for analytics/ETL loads. Let’s reconsider if those loads really do actually even generate a lot of load at all. Can they be moved to the primary? Are they latency insensitive and can use smaller replicas?
The Tonic db’s size and cost is significant. I have a few recommendations for identifying and diagnosing database load.
Care is on
r5.large and tonic
is on r7g.xlarge.
You’ve got a lot of misc small redis instances on
.small instances.
r5.large to an
m5.large. You only
exceeded 50% memory usage on this instance type once in the past 6 months,
and it doesn’t look like any size instance would have saved you. This would
save you $100/month.
r7g.xlarge to an
r5.large. This
would save you $200 a month and you’d still have the same memory available.
Yes, this is a slower CPU instance type, but this is not a performance
critical path for you (certainly not worth $2400/year).
.small instances
to .micro. There’s
about 11 of these, so that would save you an additional ~$100-150 per month.
While you’re in there, you might as well standardize the other redis
instances on
t series to
t4g as well
(currently t2 and t3). They cost the same on demand.
This is kind of a big one. I’ve seen numerous issues at past clients with UUIDv4 primary keys. That’s, obviously, your entire setup.
I frequently collaborate with Andrew Atkinson. His blog post on this exact topic recently went to the top of Hacker News.
His big points are how it nukes
IN performance:
I think the most realistic path forward for you is to wait until Postgres 18 comes out in ~Q1 and transition to UUIDV7 for all new records at that time.
You’re currently running Sidekiq with 5 threads each, which is the default these days. However, I still believe in the old default of 10 for most apps. Mike mostly changed the default to 5 as a result of database pool size issues and misconfigurations. You’re setting those correctly already so that doesn’t apply to you. For the optimal throughput-per-process, I think 10 is still best (see point above about Amdahl’s Law).
ActionMailer still uses the
default queue, as
does
Sidekiq::Batch::Callback
and a few random jobs like
Sidekiq/CareProviders::AcuityConfigurationDriftScannerJob
and
Sidekiq/CareProviders::CheckForProviderAcuityConfigDriftJob.
For me, an “SLO queue transition” should be total, and encompass all jobs. For
as long as “default” exists, there are jobs in the system whose SLO is
unclear. My goal would be to move all these jobs to an SLO queue and to remove
default from being
“listened” to/consumed by any process in production.
You’ll have a few steps on the way to making that happen:
config.action_mailer.deliver_later_queue_name
should be set to an SLO queue.
application_job.rb
should have
queue_as: :some_slo_queue.
Sidekiq::Batch.callback_queue = "my_custom_queue"
In my view, almost every application has background work that they want to get done “ASAP”. That work exists. A good example is a password reset email. Password reset emails are actively blocking a real, human user, until they are sent. So, we want to send them “as soon as possible”.
This kind of “customer blocking” work exists in most app’s background jobs somewhere.
There is a big difference between “I will begin this background job within 1 second 99% of the time” and “I will begin this background job within 1 minute 99% of the time” from a customer’s perspective.
However, there’s not a huge difference between those two promises from a provisioning perspective. Unless the load is very, very high, you probably need to provision about as many servers/tasks to meet one SLO as you do the other. In addition, both SLOs are so low/fast that they cannot be autoscaled effectively.
For those two reasons (within one second work exists, it’s not that hard to provision for within one second SLO), I think you should rename your “lowest” queue and provision to meet that SLO instead.
Your observability stack is AWS and Sentry. Sentry does not yet have arbitrary metric support for Ruby, and even if they did I don’t think they’re gonna support SLO tracking.
In AWS, we should have an alarm for each queue which goes off if the queue is above it’s promised latency.
Then, you can sum the period the alarm was “going off” and multiply by 60 (60 second per period) to get how much time over a given period you were not meeting your SLO. For example, over the last week:
aws cloudwatch get-metric-statistics \
  --namespace AWS/CloudWatch \
  --metric-name AlarmState \
  --dimensions Name=AlarmName,Value=MyAlarmName Name=StateValue,Value=ALARM \
  --statistics Sum \
  --period 60 \
  --start-time 2025-12-16T00:00:00Z \
  --end-time 2025-12-23T00:00:00Z
Example: returns 3, e.g. 3 minutes of downtime over that 7 days.
There are 10080 minutes in a week
SLO performance was 10077/10080, or 99.9%.
With queue latencies, I use these kinds of SLO measurements as my “final” yardstick. Most companies will want to be “within spec” 99% of the time or better.
I review these about once a month to ensure my autoscale rules and task count minimums are correct.
AWS observability is tricky because, as it seems you’re aware, the AWS
cloudwatch library is just making synchronous requests via HTTP to AWS
whenever you put a
metric.
Recently I discovered Yabeda, a framework from Evil Martians for reporting arbitrary observability data to arbitrary providers in Ruby.
I think we should move the following to Yabeda:
HealthCheckJob for
reporting QueueSize and QueueLatency.
PumaStats for
reporting Puma utilization
It would be a nice little upgrade on your current setup. The way you use Thread.new currently makes me nervous - it could lead to increased memory usage or instability if a lot of threads get created.
You have this
rds_under_load
variable in
care_fargate_ecs.tf
which impacts scaling decisions, essentially stopping Sidekiq scaleout if RDS
database load exceeds a particular level.
This has a couple of issues with it:
I recently created
activerecord-health, which is a gem which brings a metric very similar to
DBLoad into Ruby so
you can observe and react to database load from within your web responses or
your background jobs.
This would allow us to do things like this:
# config/initializers/sidekiq.rb
class DatabaseHealthMiddleware
  def call(_worker, job, _queue)
    if ActiveRecord::Health.load_pct >= 0.5 && queue == "within_24_hours" ||
      ActiveRecord::Health.load_pct >= 0.7 && queue == "within_1_hour"
      raise "Database unhealthy, try again later"
    end
    yield
  end
end

Sidekiq.configure_server do |config|
  config.server_middleware do |chain|
    chain.add DatabaseHealthMiddleware
  end
end
or other more sophisticated conditions.