Malloc Can Double Multi-threaded Ruby Program Memory Usage

Sometimes, it really is that simple.
It’s not every day that a simple configuration change can completely solve a problem.
I had a client whose Sidekiq processes were using a lot of memory - about a gigabyte each. They would start at about 300MB each, then slowly grow over the course of several hours to almost a gigabyte, where they would start to level off.
I asked him to change a single environment variable:
MALLOC_ARENA_MAX. “Please set it to
2.”
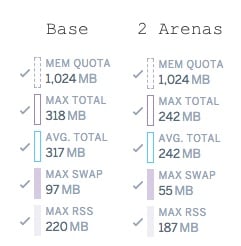
His processes restarted, and immediately the slow growth was eliminated. Processes settled at about half the memory usage they had before - around 512MB each.

Actually, it’s not that simple. There are no free
lunches. Though this one might be close to free. Like a ten
cent lunch.
Now, before you go copy-pasting this “magical” environment variable into all of your application environments, know this: there are drawbacks. You may not be suffering the problem it solves. There are no silver bullets.
Ruby is not known for being a language that’s light on memory use. Many Rails applications suffer from up to a gigabyte of memory use per process. That’s approaching Java levels. Sidekiq, the popular Ruby background job processor, has processes which can get just as large or even larger. The reasons are many, but one reason in particular is extremely difficult to diagnose and debug: fragmentation.
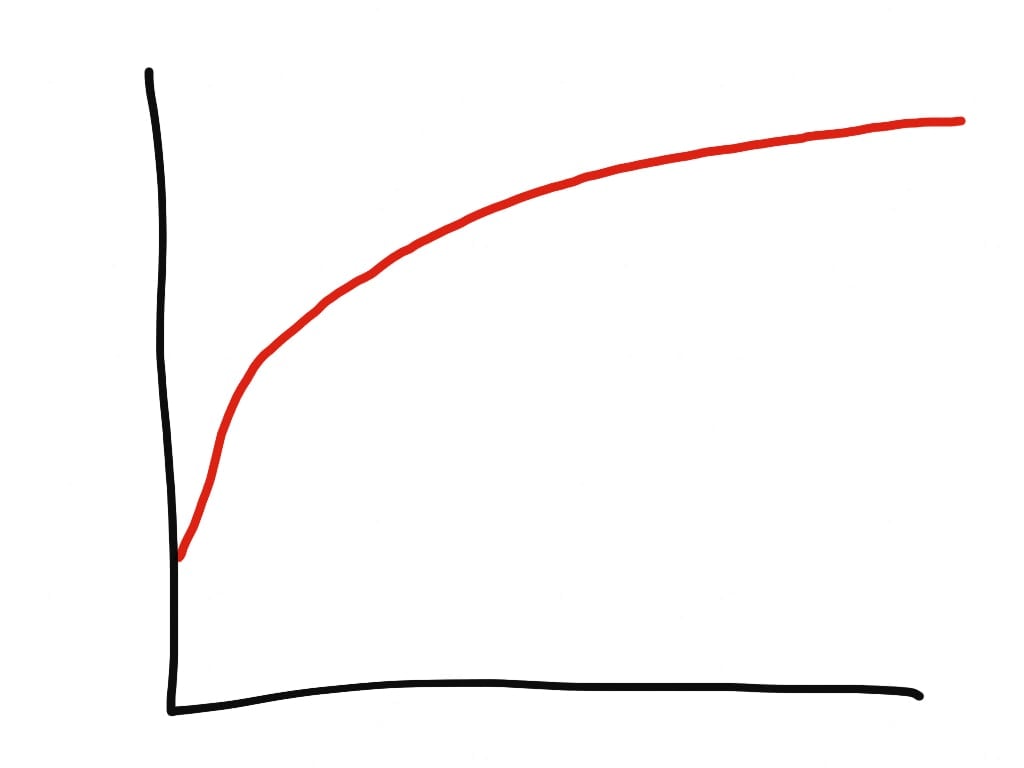
Typical Ruby memory growth looks logarithmic.
The problem manifests itself as a slow, creeping memory growth in Ruby processes. It is often mistaken for a memory leak. However, unlike a memory leak, memory growth due to fragmentation is logarithmic, while memory leaks are linear.
A memory leak in a Ruby program is usually caused by a C-extension bug. For example, if your Markdown parser leaks 10kb every time you call it, your memory growth will continue forever at a linear rate, since you tend to call the markdown parser at a regular frequency.
Memory fragmentation causes logarithmic growth in memory. It looks like a long curve, approaching some unseen limit. All Ruby processes experience some memory fragmentation. It’s an inevitable consequence of how Ruby manages memory.
In particular, Ruby cannot move objects in memory. Doing so would potentially break any C language extensions which are holding raw pointers to a Ruby object. If we can’t move objects in memory, fragmentation is an inevitable result. It’s a fairly common issue in C programs, not just Ruby.
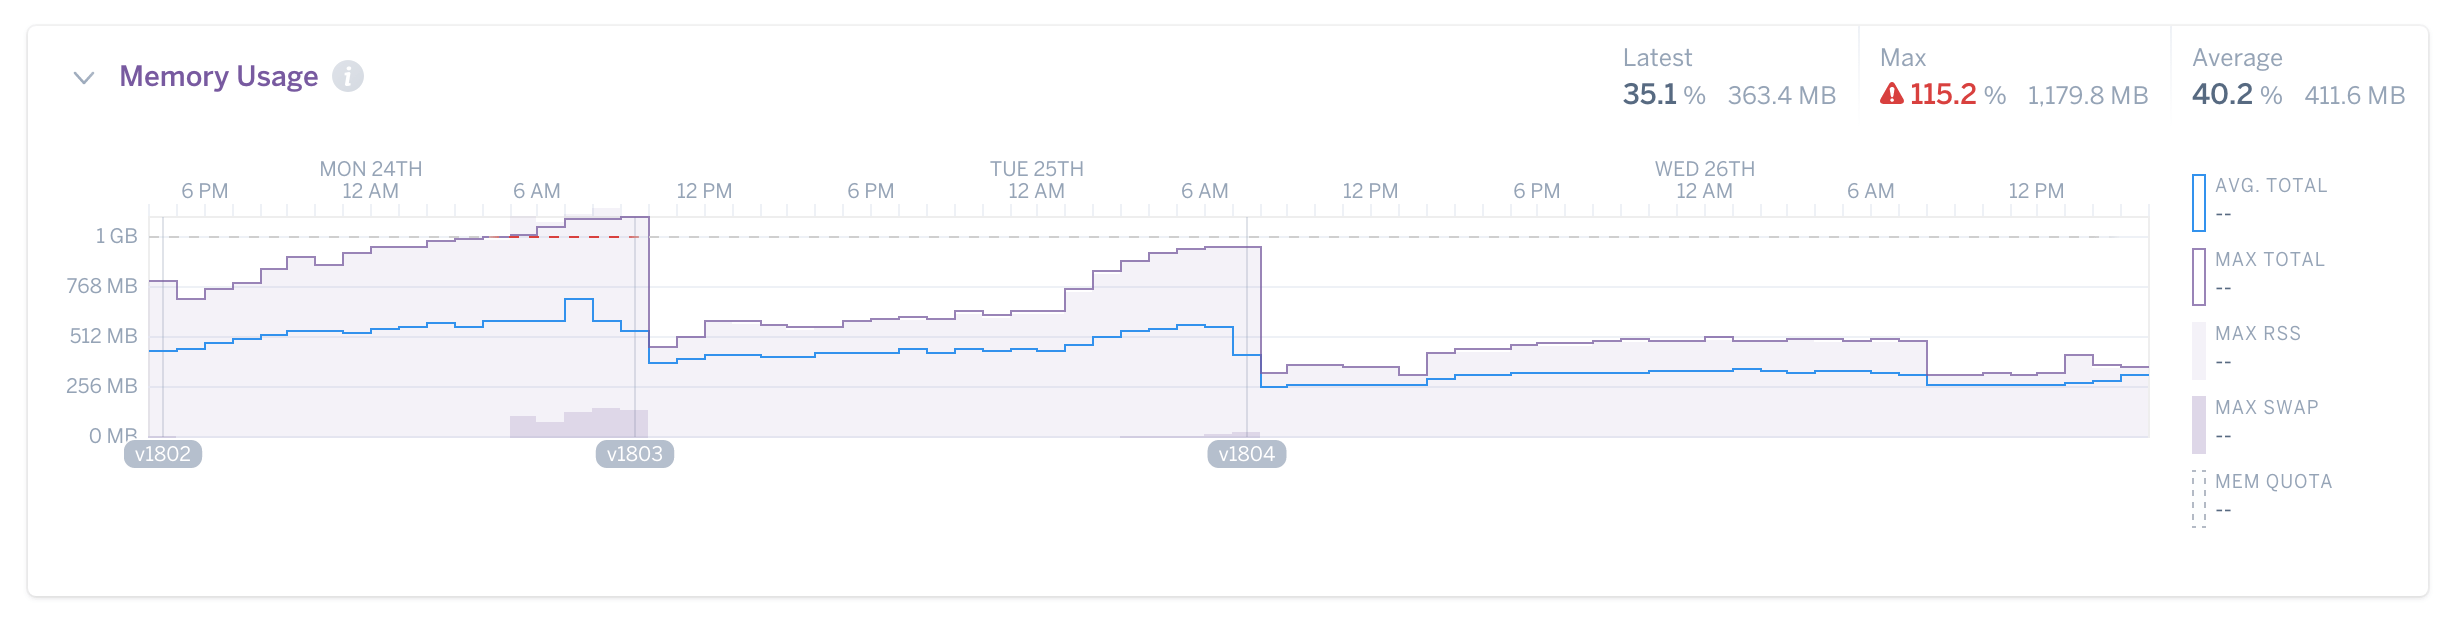
Actual client graph. This is what fragmentation
looks like. Note the enormous drop after MALLOC_ARENA_MAX
changed to 2.
However, fragmentation can sometimes cause Ruby programs to twice as much memory as they would otherwise, sometimes as much as four times more!
Ruby programmers aren’t used to thinking about memory,
especially not at the level of
malloc. And that’s OK: the entire language is designed to abstract
memory away from the programmer. It’s right in the manpage.
But while Ruby can guarantee memory safety, it cannot
provide perfect memory abstraction. One cannot be
completely ignorant of memory. Because Ruby programmers are
often inexperienced with how computer memory works, when
problems occur, they often have no idea where to even start
with debugging it, and may dismiss it as an intrinsic feature
of a dynamic, interpreted language like Ruby.

“And underneath 4 layers of memory abstraction, she
noticed some fragmentation!”
What makes it worse is that memory is abstracted away from Rubyists through four separate layers. First is the Ruby virtual machine itself, which has its own internal organization and memory tracking features (sometimes called the ObjectSpace). Second is the allocator, which differs greatly in behavior depending on the particular implementation you’re using. Third is the operating system, which abstracts actual physical memory addresses away into virtual memory addresses. The way it does this varies significantly depending on the kernel - Mach does this much differently than Linux, for example. Finally, there’s the actual hardware itself, which uses several strategies to keep frequently-accessed data in “hot” locations where it can be more quickly accessed. There are even special parts of the CPU involved here, such as the translation lookaside buffer.
This is what makes memory fragmentation so difficult for Rubyists to deal with. It’s a problem that generally happens at the level of the virtual machine and the allocator, parts of the Ruby language that 95% of Rubyists are probably unfamiliar with.
Some fragmentation is inevitable, but it can also get so bad that it doubles the memory usage of your Ruby processes. How can you know if you’re suffering the latter rather than the former? What causes critical levels of memory fragmentation? Well, I have one thesis about a cause of memory fragmentation which affects multithreaded Ruby applications, like webapps running on Puma or Passenger Enterprise, and multithreaded job processors such as Sidekiq or Sucker Punch.
Per-Thread Memory Arenas in glibc Malloc #
It all boils down to a particular feature of the standard
glibc
malloc implementation called “per-thread memory arenas”.
To understand why, I need to explain how garbage collection works in CRuby really quickly.
ObjectSpace visualization by Aaron Patterson. Each
pixel is an RVALUE. Green is “new”, red is “old”. See
heapfrag.
All objects have a entry in the
ObjectSpace. The
ObjectSpace
is a big list which contains an entry for every Ruby
object currently alive in the process. The list entries take
the form of
RVALUEs, which are 40-byte C
structs that contain some basic data about the object. The exact
contents of these structs varies depending on the class of the
object. As an example, if it is a very short String like
“hello”, the actual bits that contain the character data are
embedded directly in the
RVALUE. However, we only have 40 bytes - if the string is 23 bytes
or longer, the
RVALUE
contains only a raw pointer to where the object data
actually lies in memory, outside the
RVALUE.
RVALUEs are further organized in the
ObjectSpace
into 16KB “pages”. Each page contains about 408
RVALUEs.
These numbers can be confirmed by looking at the
GC::INTERNAL_CONSTANTS
constant in any Ruby process:
GC::INTERNAL_CONSTANTS
=> {
:RVALUE_SIZE=>40,
:HEAP_PAGE_OBJ_LIMIT=>408,
# ...
}
Creating a long string (let’s say it’s a 1000-character HTTP response for example) looks like this:
-
Add an
RVALUEto theObjectSpacelist. If we are out of free slots in theObjectSpace, we lengthen the list by 1 heap page, callingmalloc(16384). -
Call
malloc(1000)and receive a address to a 1000-byte memory location.1 (Actually, Ruby will request an area slightly larger than it needs in case the string is added to or resized.)1 Actually, Ruby will request an area slightly larger than it needs in case the string is added to or resized. This is where we’ll put our HTTP response.
The malloc calls here are what I want to bring your attention
to. All we’re doing is asking for a memory location of a
particular size, somewhere.
Actually,
malloc’s contiguity is undefined, that is, it makes no guarantees about where that
memory location will actually be. This means that, from the
perspective of the Ruby VM, fragmentation (which is
fundamentally a problem about where memory is) is a
problem of the allocator.2
(However, allocation patterns and sizes can definitely make
things harder for the allocator.)2 However, allocation
patterns and sizes can definitely make things harder for the
allocator.
Ruby can, in a way, measure the fragmentation of its own
ObjectSpace. A method in the
GC
module,
GC.stat, provides a wealth of information about the current memory
and GC state. It’s a little overwhelming and is
under-documented, but the output is a hash that looks like
this:
GC.stat
=> {
:count=>12,
:heap_allocated_pages=>91,
:heap_sorted_length=>91,
# ... way more keys ...
}
There are two keys in this hash that I want to point your
attention to:
GC.stat[:heap_live_slots]
and
GC.stat[:heap_eden_pages].
:heap_live_slots
refers to the number of slots in the
ObjectSpace
currently occupied by live (not marked for freeing)
RVALUE
structs. This is roughly the same as “currently live Ruby
objects”.

The Eden heap
:heap_eden_pages
is the number of
ObjectSpace
pages which currently contain at least one live slot.
ObjectSpace
pages which have at least one live slot are called eden pages.
ObjectSpace
pages which contain no live objects are called tomb pages.
This distinction is important from the GC’s perspective,
because tomb pages can be returned back to the operating
system. Also, the GC will put new objects into eden pages
first, and then tomb pages after all the eden pages have
filled up. This reduces fragmentation.
If you divide the number of live slots by the number of slots
in all eden pages, you get a measure of the current
fragmentation of the ObjectSpace. As an example, here’s what I
get in a fresh
irb
process:
5.times { GC.start }
GC.stat[:heap_live_slots] # 24508
GC.stat[:heap_eden_pages] # 83
GC::INTERNAL_CONSTANTS[:HEAP_PAGE_OBJ_LIMIT] # 408

# live_slots / (eden_pages * slots_per_page)
# 24508 / (83 * 408) = 72.3%
About 28% of my eden page slots are currently unoccupied. A high percentage of free slots indicates that the ObjectSpace’s RVALUEs are spread across many more heap pages than they would be if we could move them around. This is a kind of internal memory fragmentation.
Another measure of internal fragmentation in the Ruby VM comes
from
GC.stat[:heap_sorted_length]. This key is the “length” of the heap. If we have three
ObjectSpace pages, and I
free
the 2nd one (the one in the middle), I only have two heap
pages remaining. However, I cannot move heap pages around in
memory, so the “length” of the heap (essentially the highest
index of the heap pages) is still 3.

Yes, this heap is fragmented, but it looks
really tasty.
Dividing
GC.stat[:heap_eden_pages]
by
GC.stat[:heap_sorted_length]
gives a measure of internal fragmentation at the level of
ObjectSpace pages - a low percentage here would indicate a lot
of heap-page-sized “holes” in the ObjectSpace list.
While these measures are interesting, most memory
fragmentation (and most allocation) doesn’t happen in the
ObjectSpace
- it happens in the process of allocating space for objects
which don’t fit inside a single
RVALUE. It turns out that’s most of them, according to experiments
performed by Aaron Patterson and Sam Saffron. A typical Rails
app’s memory usage will be 50%-80% in these
malloc
calls to get space for objects larger than a few bytes.
Well this sucks. Looks like only 15% of the heap in a basic Rails app is managed by the GC. 85% is just mallocs pic.twitter.com/sPbtAq4g8j
— Aaron Patterson (@tenderlove) June 28, 2017
When Aaron says “managed by the GC” here, he means “inside the
ObjectSpace
list”.
Ok, so let’s talk about where per-thread memory arenas come in.
The per-thread memory arena was an optimization introduced in
glibc
2.10,
and lives today in
arena.c. It’s designed to decrease contention between threads when
accessing memory.
In a naive, basic allocator design, the allocator makes sure only one thread can request a memory chunk from the main arena at a time. This ensures that two threads don’t accidentally get the same chunk of memory. If they did, that would cause some pretty nasty multi-threading bugs. However, for programs with a lot of threads, this can be slow, since there’s a lot of contention for the lock. All memory access for all threads is gated through this lock, so you can see how this could be a bottleneck.
Removing this lock has been an area of major effort in allocator design because of its performance impact. There are even a few lockless allocators out there.
The per-thread memory arena implementation alleviates lock contention with the following process (paraphrased from this article by Siddhesh Poyarekar):
-
We call
mallocin a thread. The thread attempts to obtain the lock for the memory arena it accessed previously (or the main arena, if no other arenas have been created). - If that arena is not available, try the next memory arena (if there are any other memory arenas).
- If none of the memory arenas are available, create a new arena and use that. This new arena is linked to to the last arena in a linked list.
In this way, the main arena is basically extended into a
linked list of arenas/heaps. The number of arenas is limited
by
mallopt, specifically the
M_ARENA_MAX
parameter (documented
here, note the “environment variables” section). By default, the
limit on the number of per-thread memory arenas that can be
created is 8 times the number of available cores. Most Ruby
web applications run about 5 threads per core, and Sidekiq
clusters can often run far more than that. In practice, this
means that many, many per-thread memory arenas can get created
by a Ruby application.
Let’s take a look at exactly how this would play out in a multithreaded Ruby application.
- You are running a Sidekiq process with the default setting of 25 threads.
- Sidekiq begins running 5 new jobs. Their job is to communicate with an external credit card processor - so they POST a request via HTTPS and receive a response ~3 seconds later.
-
Each job (which is running a separate thread in Rubyland)
sends an HTTP request and waits for a response using the
IOmodule. Generally, almost all IO in CRuby releases the Global VM lock, which means that these threads are working in parallel and may contend for the main memory arena lock, causing the creation of new memory arenas.
If multiple CRuby threads are running but not doing I/O, it is pretty much impossible for them to contend for the main memory arena because the Global VM Lock prevents two Ruby threads from executing Ruby code at the same time. Thus, per-thread-memory arenas only affect CRuby applications which are both multithreaded and performing I/O.
How does this lead to memory fragmentation?
Bin-packing can be fun, too!
Memory fragmentation is essentially a bin packing problem - how can we efficiently distribute oddly-sized items between multiple bins so that they take up the least amount of space? Bin-packing is made much more difficult for the allocator because a) Ruby never moves memory locations around (once we allocate a location, the object/data stays there until it is freed) b) per-thread memory arenas essentially create a lot of different bins, which cannot be combined or “packed” together. Bin-packing is already NP-hard, and these constraints just make it even more difficult to achieve an optimal solution.
Per-thread memory arenas leading to large amounts of RSS use over time is something of a known issue on the glibc malloc tracker. In fact, the MallocInternals wiki says specifically:
As pressure from thread collisions increases, additional arenas are created via mmap to relieve the pressure. The number of arenas is capped at eight times the number of CPUs in the system (unless the user specifies otherwise, see mallopt), which means a heavily threaded application will still see some contention, but the trade-off is that there will be less fragmentation.
There you have it - lowering the number of available memory arenas reduces fragmentation. There’s an explicit tradeoff here: fewer arenas decreases memory use, but may slow the program down by increasing lock contention.
Heroku discovered this side-effect of per-thread memory arenas when they created the Cedar-14 stack, which upgraded glibc to version 2.19.
Heroku customers reported greater memory consumption of their applications when upgrading their apps to the new stack. Testing by Terrence Hone of Heroku produced some interesting results:
| Configuration | Memory Use |
|---|---|
| Base (unlimited arenas) | 1.73x |
| Base (before arenas introduced) | 1x |
| MALLOC_ARENA_MAX=1 | 0.86 |
| MALLOC_ARENA_MAX=2 | 0.87 |
Basically, the default memory arena behavior in libc 2.19 reduced execution time by 10%, but increased memory use by 75%! Reducing the maximum number of memory arenas to 2 essentially eliminated the speed gains, but reduced memory usage over the old Cedar-10 stack by 10% (and reduced memory usage by about 2X over the default memory arena behavior!).
| Configuration | Response Times |
|---|---|
| Base (unlimited arenas) | 0.9x |
| Base (before arenas introduced) | 1x |
| MALLOC_ARENA_MAX=1 | 1.15x |
| MALLOC_ARENA_MAX=2 | 1.03x |
For almost all Ruby applications, a 75% memory gain for 10% speed gain is not an appropriate tradeoff. But let’s get some more real-world results in here.
A Replicating Program #
I wrote a demo application, which is a Sidekiq job which generates some random data and writes the response to a database.
After switching
MALLOC_ARENA_MAX
to 2, memory usage was 15% lower after 24 hours.
I’ve noticed that real-world workloads magnify this effect
greatly, which means I don’t fully understand the allocation
pattern which can cause this fragmentation yet. I’ve seen
plenty of memory graphs on the
Complete Guide to Rails Performance
Slack channel that show 2-3x memory savings in production with
MALLOC_ARENA_MAX=2.
Fixing the Problem #
There are two main solutions for this problem, along with one possible solution for the future.
Fix 1: Reduce Memory Arenas #
One fairly obvious fix would be to reduce the maximum number
of memory arenas available. We can do this by changing the
MALLOC_ARENA_MAX
environment variable. As mentioned before, this increases lock
contention in the allocator and will have a negative
impact on the performance of your application across the
board.
It’s impossible to recommend a generic setting here, but it
seems like 2 to 4 arenas is appropriate for most Ruby
applications. Setting
MALLOC_ARENA_MAX
to 1 seems to have a high negative impact on performance with
only a very marginal improvement to memory usage (1-2%).
Experiment with these settings and
measure the results both in memory use reduction and
performance reduction until you’ve made a tradeoff appropriate
for your app.
Fix 2: Use
jemalloc
#
This is CodeTriage's Sidekiq worker memory use with and without jemalloc. I'm really starting to wonder how much of Ruby's memory problems are just caused by the allocator. pic.twitter.com/FD0fVbJCLt
— Nate Berkopec (@nateberkopec) December 1, 2017
Another possible solution is to simply use a different
allocator.
jemalloc
also implements per-thread arenas, but their design seems to
avoid the fragmentation issues present in
malloc.
The above tweet was from when I removed jemalloc from
CodeTriage’s
background job processes. As you can see, the effect was
pretty drastic. I also experimented with using
malloc
with
MALLOC_ARENA_MAX=2, but memory usage was still almost 4 times greater
than memory usage with
jemalloc.
If you can switch to jemalloc with Ruby, do it.
It seems to have the same or better performance than
malloc
with far less memory use.
This isn’t a
jemalloc
blog post, but some finer points on using
jemalloc
with Ruby:
- You can use it on Heroku with this buildpack.
-
Do not use
jemalloc4.x with Ruby. It has a bad interaction with Transparent Huge Pages that reduces the memory savings you’ll see. Instead, usejemalloc3.6. 5.0’s performance with Ruby is currently unknown. - You do not need to compile Ruby with jemalloc (though you can). You can dynamically load it with LD_PRELOAD.
Fix 3: Compacting GC #
Fragmentation can generally be reduced if one can move locations in memory around. We can’t do that in CRuby because C-extensions may use raw pointers to refer to Ruby’s memory - moving that location would cause a segfault or incorrect data to be read.
Aaron Patterson has been working on a compacting garbage collector for a while now. The work looks promising, but perhaps a ways off in the future.
TL;DR: #
Multithreaded Ruby programs may be consuming 2 to 4 times the
amount of memory that they really need, due to fragmentation
caused by per-thread memory arenas in
malloc. To fix this, you can reduce the maximum number of arenas by
setting the
MALLOC_ARENA_MAX
environment variable or by switching to an allocator with
better performance, such as
jemalloc.
The potential memory savings here are so great and the
penalties so minor that
I would recommend that if you are using Ruby and Puma or
Sidekiq in production, you should always use
jemalloc.
While this effect is most pronounced in CRuby, it may also affect the JVM and JRuby.
Want a faster website?
I'm Nate Berkopec (@nateberkopec). I write online about web performance from a full-stack developer's perspective. I primarily write about frontend performance and Ruby backends. If you liked this article and want to hear about the next one, click below. I don't spam - you'll receive about 1 email per week. It's all low-key, straight from me.
Products from Speedshop
The Complete Guide to Rails Performance is a full-stack performance book that gives you the tools to make Ruby on Rails applications faster, more scalable, and simpler to maintain.
Learn more
The Rails Performance Workshop is the big brother to my book. Learn step-by-step how to make your Rails app as fast as possible through a comprehensive video and hands-on workshop. Available for individuals, groups and large teams.
Learn more
More Posts
Announcing the Rails Performance Apocrypha
I've written a new book, compiled from 4 years of my email newsletter.
We Made Puma Faster With Sleep Sort
Puma 5 is a huge major release for the project. It brings several new experimental performance features, along with tons of bugfixes and features. Let's talk about some of the most important ones.
The Practical Effects of the GVL on Scaling in Ruby
MRI Ruby's Global VM Lock: frequently mislabeled, misunderstood and maligned. Does the GVL mean that Ruby has no concurrency story or CaN'T sCaLe? To understand completely, we have to dig through Ruby's Virtual Machine, queueing theory and Amdahl's Law. Sounds simple, right?
The World Follows Power Laws: Why Premature Optimization is Bad
Programmers vaguely realize that 'premature optimization is bad'. But what is premature optimization? I'll argue that any optimization that does not come from observed measurement, usually in production, is premature, and that this fact stems from natural facts about our world. By applying an empirical mindset to performance, we can...