Configuring Puma, Unicorn and Passenger for Maximum Efficiency

In Ruby, web application servers are like gasoline in a car:
the fancy stuff won’t make your car go any faster, but the
nasty stuff will bring you grinding to a halt. Application
servers can’t actually make your app significantly
faster - no, they’re all pretty much the same and
changing from one to the other won’t improve your throughput
or response times by much. But it is easy to shoot
yourself in the foot with a bad setting or misconfigured
server. It’s one of the most common problems I see on client
applications.
This post will be about optimizing resource usage (memory and CPU) and maximizing throughput (that is, requests-per-second) from the three major Ruby application servers: Puma, Unicorn and Passenger. I’m going to use the terms “server” and “container” interchangeably, because nothing here is specific to a virtualized environment.
I can cover all three of the popular application servers in a
single guide because they all use, fundamentally, the same
design. With the
fork
system call, these application servers create several child
processes, which then do the job of serving requests.
1
(In all three app servers, the ‘master’ process that creates
the child processes does not actually answer any requests.
Passenger will actually shut down the ‘master’ preload
process after a while if you haven’t forked recently.)1 In all three app
servers, the ‘master’ process that creates the child
processes does not actually answer any requests. Passenger
will actually shut down the ‘master’ preload process after a
while if you haven’t forked recently.
Most of the differences between these servers lie in the finer
details (which I’ll also cover here, where important for
maximum performance).
Throughout this guide, we’re going to try to maximize our throughput-per-server-dollar. We want to serve the most number of requests per second for the lowest amount of server resources (and therefore, cash).
The most important configuration settings for performance #

Timeouts are fairly important too, but they’re not
really throughput-related. I’ll leave them for another
day.
There are 4 fundamental settings on your application server that determine its performance and resource consumption:
- Number of child processes.
- Number of threads.
- Copy-on-write.
- Container size.
Let’s go through each in turn.
Child process count #
Unicorn, Puma and Passenger all use a
forking design.2
(JRuby people can probably skip to the next section.)2 JRuby people can
probably skip to the next section.
This means that they create one application process and call
fork
a number of times to create copies of that application
process. We call these copies child processes. The number of
child processes we have on each server is probably the most
important setting for maximizing throughput-per-server-dollar.
3
(This is because of CRuby’s Global VM Lock. Only one thread
can execute Ruby code at a time, so the only way to achieve
parallel Ruby work is to run multiple processes.)3 This is because of
CRuby’s Global VM Lock. Only one thread can execute Ruby
code at a time, so the only way to achieve parallel Ruby
work is to run multiple processes.
We want to run
as many processes per server as possible without
exceeding the resources of the server.
I recommend that all Ruby webapps run at least 3 processes per server or container. This maximizes routing performance. Puma and Unicorn both use a design where the child processes listen directly on a single socket, and then let the operating system balance load between the processes. Passenger uses a reverse proxy (nginx or Apache) to route requests to a child process.5 (Passenger’s least-busy-process-first routing is actually one of my favorite features of theirs.)5 Passenger’s least-busy-process-first routing is actually one of my favorite features of theirs. Both approaches are pretty efficient and mean that a request will be quickly routed to a worker that is idle. Routing at higher layers (that is, at the load balancer or Heroku’s HTTP mesh) is far more difficult to do so efficiently, because the load balancer usually has no idea whether or not the servers its routing to are busy or not.6 (For one client I had, moving from 30 servers with 2 processes each to 3 servers with 20 processes each almost completely eliminated the timeout errors they were having (which were being caused by fast requests piling up behind slow ones).)6 For one client I had, moving from 30 servers with 2 processes each to 3 servers with 20 processes each almost completely eliminated the timeout errors they were having (which were being caused by fast requests piling up behind slow ones).
Consider a setup with 3 servers, each running 1 processes (so
a total of 3 processes). How does the load balancer optimally
route a request to one of the three servers? It could do so
randomly or in a round-robin fashion, but this does not
guarantee that the request will be routed to a server with an
idle, waiting process. For example, with a round-robin
strategy, let’s say Request A is routed to server #1. Request
B is then routed to server #2, and Request C to server #3.

My face when you give me a request but all my
children are busy.
Now here comes a fourth request, Request D. What happens if
Request B and C have already been successfully served and
those servers (2 and 3) are idle, but Request A was somebody’s
CSV export and will take 20 seconds to complete? The load
balancer will continue to give requests to server #1 even
though its busy and won’t process them until it’s done with
Request A. All load balancers have ways of knowing if a server
is completely dead, but most of these methods have a
long lag time (i.e. 30 seconds or more of delay). Running
higher numbers of processes per server insulates us from the
risk of long-lived requests “hogging” the majority of a
server’s child processes, because at the
server level, requests will never be given
to an already-busy process. Instead, they’ll back up at the
socket level or the reverse proxy until a worker is free. From
experience, I find that 3 processes per server is a good
minimum to achieve this. If you can’t run at least 3 processes
per server due to resource constraints, get a bigger server
(more on that later).
So, we should run at least 3 child processes per container. But what’s the maximum? That’s constrained by our memory and CPU resources.
Let’s start with memory. Each child process uses a certain amount of memory. Obviously, we shouldn’t add more child processes than our server’s RAM can support!
Actual memory usage of Ruby processes is
logarithmic. Due to memory fragmentation, memory usually
doesnt level off, but only approaches a limit.
Measuring the actual memory usage of a single Ruby application
process can be tricky, however. It’s not enough to just start
up a process on your computer or production environment and
check the number right away.

After a while, Puma workers can get rather…
large.
For a number of reasons,
Ruby web application processes increase in memory usage
over time, even as much as doubling or tripling their memory usage
from when they are spawned. To get an accurate measurement of
how much memory your Ruby application processes are using,
disable all process restarts (worker killers) and
wait 12-24 hours to take a measurement with
ps.
If you’re on Heroku, you can use the new
Heroku Exec
to use
ps
on a running dyno, or simply divide Heroku’s memory usage
metric by the number of processes you are running per dyno.
Most Ruby applications will use between 200 and 400 MB per
process, but some can use as much as 1GB.

1 upvote = 1 prayer
Be sure to give yourself some headroom on the memory number -
if you want an equation, set your child process count to
something like (TOTAL_RAM
/ (RAM_PER_PROCESS
* 1.2))
Exceeding the available memory capacity of a server/container can cause major slowdowns as memory is overcommitted and swapping starts to occur. This is why you want your application’s memory usage to be predictable and consistent with no sudden spikes. Sudden increases in memory usage are a condition I call memory bloat. Solving this is a topic for another day or post, but the topic is covered in The Complete Guide to Rails Performance
Second, we don’t want to exceed the available CPU capacity of our server. Ideally, we don’t spend more than 5% of our total deployed time at 100% CPU usage - more than that means that we’re being bottlenecked by the available CPU capacity. Most Ruby and Rails applications tend to be memory-bottlenecked on most cloud providers, but sometimes CPU can be the bottlenecking resource too. How do you know? Just use your favorite server monitoring tool - AWS’s built in tools are probably good enough for figuring out if CPU usage is frequently maxing out.

You said that OS context switching was expensive.
Actual production use determined that was a lie.
It’s frequently said that you shouldn’t have more child
processes per server than CPUs. This is only
partly true. It’s a good starting point, but actual
CPU usage is the metric you should watch and optimize. In
practice, most applications will probably settle at a process
count that is 1.25-1.5x the number of available hyperthreads.
On Heroku, use log-runtime-metrics to get a CPU load metric written to your logs. I would look at the 5 and 15 minute load averages - if they are consistently close to or higher than 1, you are maxing out CPU and need to reduce child process counts.
Setting child process counts is pretty easy in every application server:
# Puma
$ puma -w 3 # Command-line option
workers 3 # in your config/puma.rb

# Unicorn
worker_processes 3 # config/unicorn.rb

# Passenger (nginx/Standalone)
# Passenger can automatically scale workers up and down - I don't find this
# super useful. Instead, just run a constant number by setting the max and min:
passenger_max_pool_size 3;
passenger_min_instances 3;
Instead of setting this to a hard number, you may want to set
it to an environment variable such as
WEB_CONCURRENCY:
workers Integer(ENV["WEB_CONCURRENCY"] || 3)
In summary, most applications will want to use 3-8 processes per server, depending on available resources. Highly memory-constrained applications or apps which have high 95th percentile times (5-10 seconds or more) may want to run higher numbers, up to 4x the available hyperthread count. Most app’s child process counts should not exceed 1.5x the amount of available hyperthreads.
Thread count #
Puma and Passenger Enterprise support multi-threading your application, so this discussion is aimed at those servers.
Threads can be a resource-light way of improving your
application’s concurrency (and, therefore, throughput). Rails
is already threadsafe, and most applications aren’t doing
weird things like creating their own threads or using globals
to access shared resource, like database connections (looking
at you,
$redis!) So, most Ruby web-applications are thread-safe.
The only real way to know is to actually give it a
shot. Ruby applications tend to surface threading bugs in
loud, exception-raising ways, so it’s easy to give it a shot
and see the results.
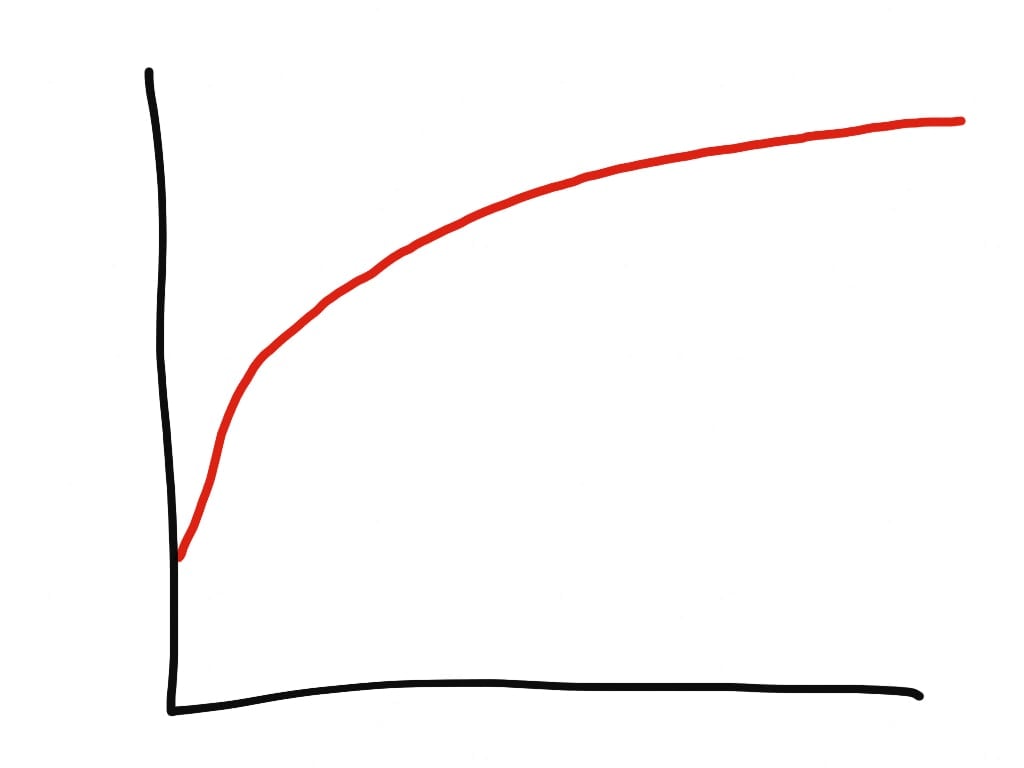
So how many threads should we use? The speedup you can gain
from additional parallelism depends on the
portion of your program’s execution which can be done in
parallel.
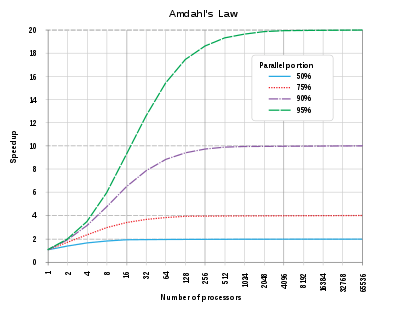
This is known as Amdahl’s Law. In MRI/C Ruby, we can only parallelize waiting on IO
(waiting on a database result, for example). For
most web applications, this is probably 10-25% of
their total time. You can check for your own application by
looking at the amount of time you spend “in the database” per
request. Unfortuantely, what Amdahl’s law reveals is that for
programs that have small parallel portions (less than 50%),
there is little to no benefit past a handful of threads. This
matches my own experience: on client applications, thread
settings of more than 5 have no effect.
Noah Gibbs also tested this against the Discourse homepage
benchmark
and settled on a thread count of 6.

Unlike process count, where I advise you to constantly check
the metrics against your settings and tune appropriately, with
threads, it’s usually OK to just “set it and forget it” to 5
threads per application server process.
In MRI/C Ruby, threads can have a surprisingly large memory impact. This is due to a host of complicated reasons (which I’ll probably get into in a future post). Be sure to check memory consumption before and after adding threads to the application. Do not expect that each thread will only consume an additional 8MB of stack space, they will often increase total memory usage by far more than that.
Here’s how to set thread counts:
# Puma. Again, I don't really use the "automatic" spin-up/spin-down features, so
# I set the max and min to the same number.
$ puma -t 5:5 # Command-line option
threads 5, 5 # in your config/puma.rb

# Passenger (nginx/Standalone)
passenger_concurrency_model thread;
passenger_thread_count 5;
For JRuby people - threads are fully parallelizable, so you can take the full benefit of Amdahl’s law here. Setting thread counts for you will be more like setting process counts under MRI (described above) - increase them until you run out of memory or CPU resources.
Copy-on-write behavior #
All Unix-based operating systems implement copy-on-write
memory behavior. It’s pretty simple: when a process
forks and creates a child, that child process’ memory is
shared, completely, with the parent process. All
memory reads from the child process will simply read from the
parent’s memory. However, modifying a memory location creates
a copy, solely for the private use of the child process. It’s
extremely useful for reducing the memory usage of forking
webservers, since child processes should, in theory, be able
to share things like shared libraries and other “read-only”
memory with the parent, rather than creating their own copy.
Copy-on-write just happens.
6
(You can’t really ‘support’ copy-on-write so much as just
‘make it more effective at saving you memory’.)6 You can’t really
‘support’ copy-on-write so much as just ‘make it more
effective at saving you memory’.
It can’t be “turned off”, but you can make it more effective.
Basically, we want to load all of our application
before forking. Most Ruby webapp servers call this
“preloading”. All it does is change when
fork
is called - before or after your application is initialized.
You’ll also need to re-connect to any databases you’re using after forking. For example, with ActiveRecord:
# Puma
preload_app!
on_worker_boot do
  # Valid on Rails 4.1+ using the `config/database.yml` method of setting `pool` size
  ActiveRecord::Base.establish_connection
end

# Unicorn
preload_app true
after_fork do |server, worker|
	ActiveRecord::Base.establish_connection
end

# Passenger uses preloading by default, so no need to turn it on.
# Passenger automatically establishes connections to ActiveRecord,
# but for other DBs, you will have to:
PhusionPassenger.on_event(:starting_worker_process) do |forked|
  if forked
    reestablish_connection_to_database # depends on the DB
  end
end
In theory, you have to do this for every database your application uses. However, in practice, Sidekiq doesn’t try to connect to Redis until you actually try to do something, so unless you’re running Sidekiq jobs during application boot, you don’t have to reconnect after fork.
Unfortunately, there are limits to the gains of copy-on-write. Transparent Huge Pages can cause even a 1-bit memory modification to copy an entire 2MB page, and fragmentation can also limit savings. But it doesn’t hurt, so turn on preloading anyway.
Container size #

Gimme some of that memory, boi
In general, we want to make sure we’re utilizing 70-80% of our
server’s available CPU and memory. These needs will differ
between applications, and the ratio between CPU cores and GB
of memory will differ in turn. One application might be
happiest on a 4 vCPU / 4 GB of RAM server with 6 Ruby
processes, while another less-memory-hungry and more CPU-heavy
application might do well with 8 vCPUs and 2GB of RAM. There’s
no one perfect container size, but the ratio between CPU and
memory should be chosen based on your actual production
metrics.

The
amount of memory available to our server or
container
is probably one of the most important resources we can tune.
On many providers, this number is exceedingly low - 512MB on
the standard Heroku dyno, for example. Ruby applications,
especially sufficiently complex and mature ones, are memory
hungry, and the amount of memory we have to work with is
probably one of our most important resources.
Because most Rails applications use ~300MB of RAM and I think everyone should be running at least 3 processes per server, most Rails applications will need a server with at least 1 GB of RAM.
Our server’s CPU resources are another important lever we can tune. We need to know how many CPU cores are available to us, and how many threads we can execute at a single time (basically, does this server support Hyper-Threading or not?).
As I mentioned in the discussion of child process counts, your container should support at least 3 child processes. Even better would be 8 or more processes per server/container. Higher process counts per container improves request routing and decreases latency.
TL;DR #
This was an overview of how to best maximize the throughput of your Ruby web application servers. In a short, list format, here’s the steps:
-
Figure out how much memory 1 worker with 5 threads
uses.
If you’re using Unicorn, obviously no threads required. Run
just a few workers on a single server under production load
for at least 12 hours without restarting. Use
psto get the memory usage of a typical worker. -
Choose a container size with memory equal to at least 3X
that number. Most Rails applications will use ~300-400MB of RAM per
worker. So, most Rails apps will need at least 1 GB
container/server. This gives us enough memory headroom to
run at least 3 processes per server. You can run a number of
child processes equal to (
TOTAL_RAM/ (RAM_PER_PROCESS* 1.2)). - Check CPU core/hyperthread counts If your container has fewer hyperthreads (vCPUs on AWS) than your memory can support, you can either choose a container size with less memory or more CPU. Ideally, the number of child processes you run should equal 1.25-1.5x the number of hyperthreads.
- Deploy and watch CPU and memory consumption. Tune child process count and container size as appropriate to maximize usage.
Want a faster website?
I'm Nate Berkopec (@nateberkopec). I write online about web performance from a full-stack developer's perspective. I primarily write about frontend performance and Ruby backends. If you liked this article and want to hear about the next one, click below. I don't spam - you'll receive about 1 email per week. It's all low-key, straight from me.
Products from Speedshop
The Complete Guide to Rails Performance is a full-stack performance book that gives you the tools to make Ruby on Rails applications faster, more scalable, and simpler to maintain.
Learn more
More Posts
Organization for Transformative Works Performance Audit
A Rails performance audit report for the Organization for Transformative Works and Archive of Our Own.
Announcing the Rails Performance Apocrypha
I've written a new book, compiled from 4 years of my email newsletter.
We Made Puma Faster With Sleep Sort
Puma 5 is a huge major release for the project. It brings several new experimental performance features, along with tons of bugfixes and features. Let's talk about some of the most important ones.
The Practical Effects of the GVL on Scaling in Ruby
MRI Ruby's Global VM Lock: frequently mislabeled, misunderstood and maligned. Does the GVL mean that Ruby has no concurrency story or CaN'T sCaLe? To understand completely, we have to dig through Ruby's Virtual Machine, queueing theory and Amdahl's Law. Sounds simple, right?