The World Follows Power Laws: Why Premature Optimization is Bad
(This post is a sample of the content available in the Complete Guide to Rails Performance. It’s actually the first lesson - there are 30+ more lessons and 18 hours of video in the course itself.)This post is a sample of the content available in the Complete Guide to Rails Performance. It’s actually the first lesson - there are 30+ more lessons and 18 hours of video in the course itself.
I want to tell you about a physicist from Schenectady, a Harvard linguist, and an Italian economist.

Pareto’s poltiical views are bit suspect,
unfortunately, because he chose to see the way things
are (unequal) as the way they
ought to be.
The Italian economist you may already have heard of - Vilifredo Pareto. He became famous for something called The Pareto Principle, the idea that for most things, 80% of the effect comes from just 20% of the causes. The Pareto Principle is fundamental to performance work because it reminds us why premature optimization is so inefficient and useless. While you’ve probably heard of the Pareto Principle, I want you to understand why it actually works. And to do that, we’re going to have to talk about probability distributions.
Benford - the physicist #
Frank Benford was an American electrical engineer and
physicist who worked for General Electric. It was the early
20th century, when you had a job for life rather than a
startup gig for 18 months, so he worked there from the day he
graduated from the University of Michigan until his death 38
years later in 1948.
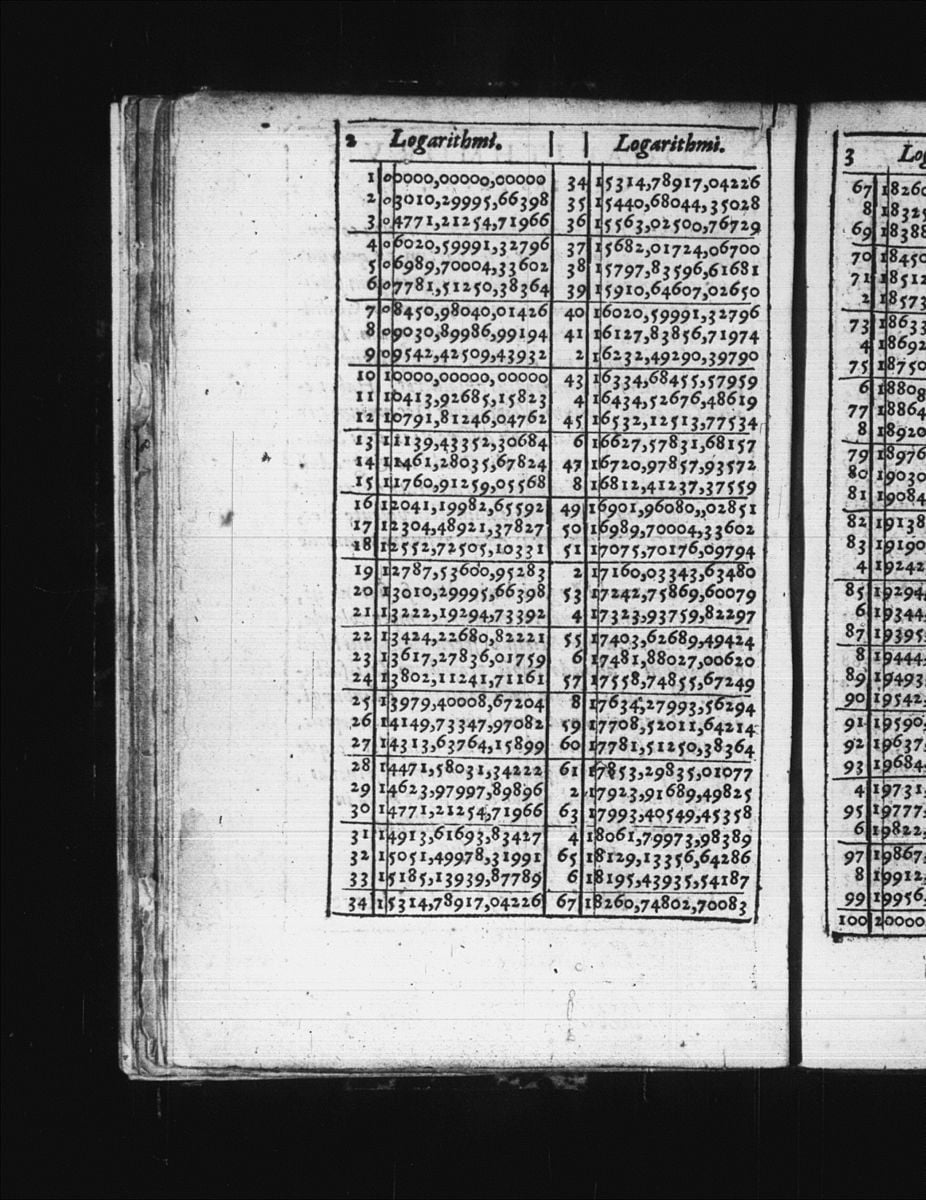
A page from Henry Briggs’ first table of common
logarithms, Logarithmorum Chilias Prima, from 1617.
Wikipedia
Back in that time, before calculators, if you wanted to know the logarithm of a number - say, 12 - you looked it up in a book. The books were usually organized by the leading digit. If you wanted to know the logarithm of 330, you first went to the section for 3, then looked for 330. Benford noticed that the first pages of the book were far more worn out than the last pages. Benford realized this meant that the numbers looked up in the table began more often with 1 than with 9.
Most people would have noticed that and thought nothing of it. But Benford pooled 20,000 numbers from widely divergent sources (he used the numbers in newspaper stories) and found that the leading digit of all those numbers followed a power law too.
This became known as Benford’s Law. Here are some other sets of numbers that conform to this power law:
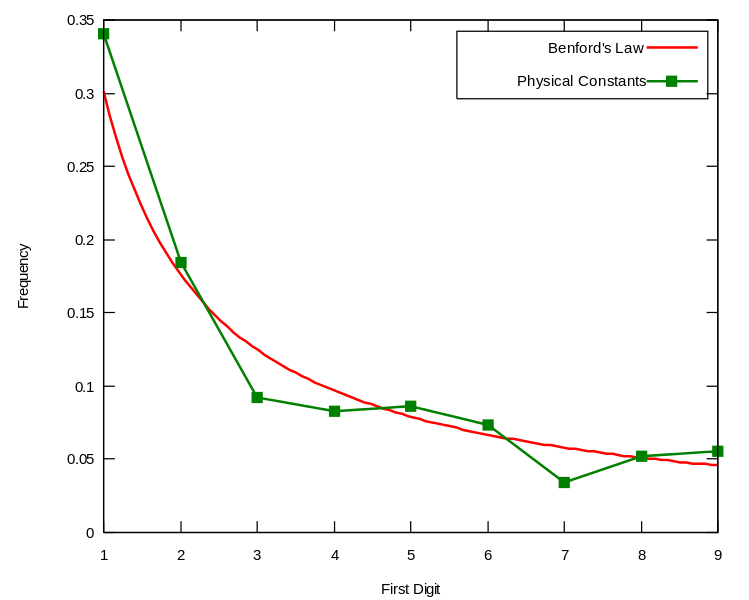
- Physical constants of the universe (pi, the molar constant, etc.)
- Surface areas of rivers
- Fibonacci numbers
- Powers of 2
- Death rates
- Population censuses
That the physical constants of the universe follow this distribution is probably the most mind-blowing revelation of Benford’s Law, for me, anyway.
Benford’s Law is so airtight that it’s been admitted in US courts as evidence of accounting fraud (someone used RAND in their Excel sheet!). It’s been used to identify other types of fraud too - elections, scientific and even macroeconomic data.
What would cause numbers that have (seemingly) little relationship with each other to conform so perfectly to this non-random distribution?
Zipf - the linguist #
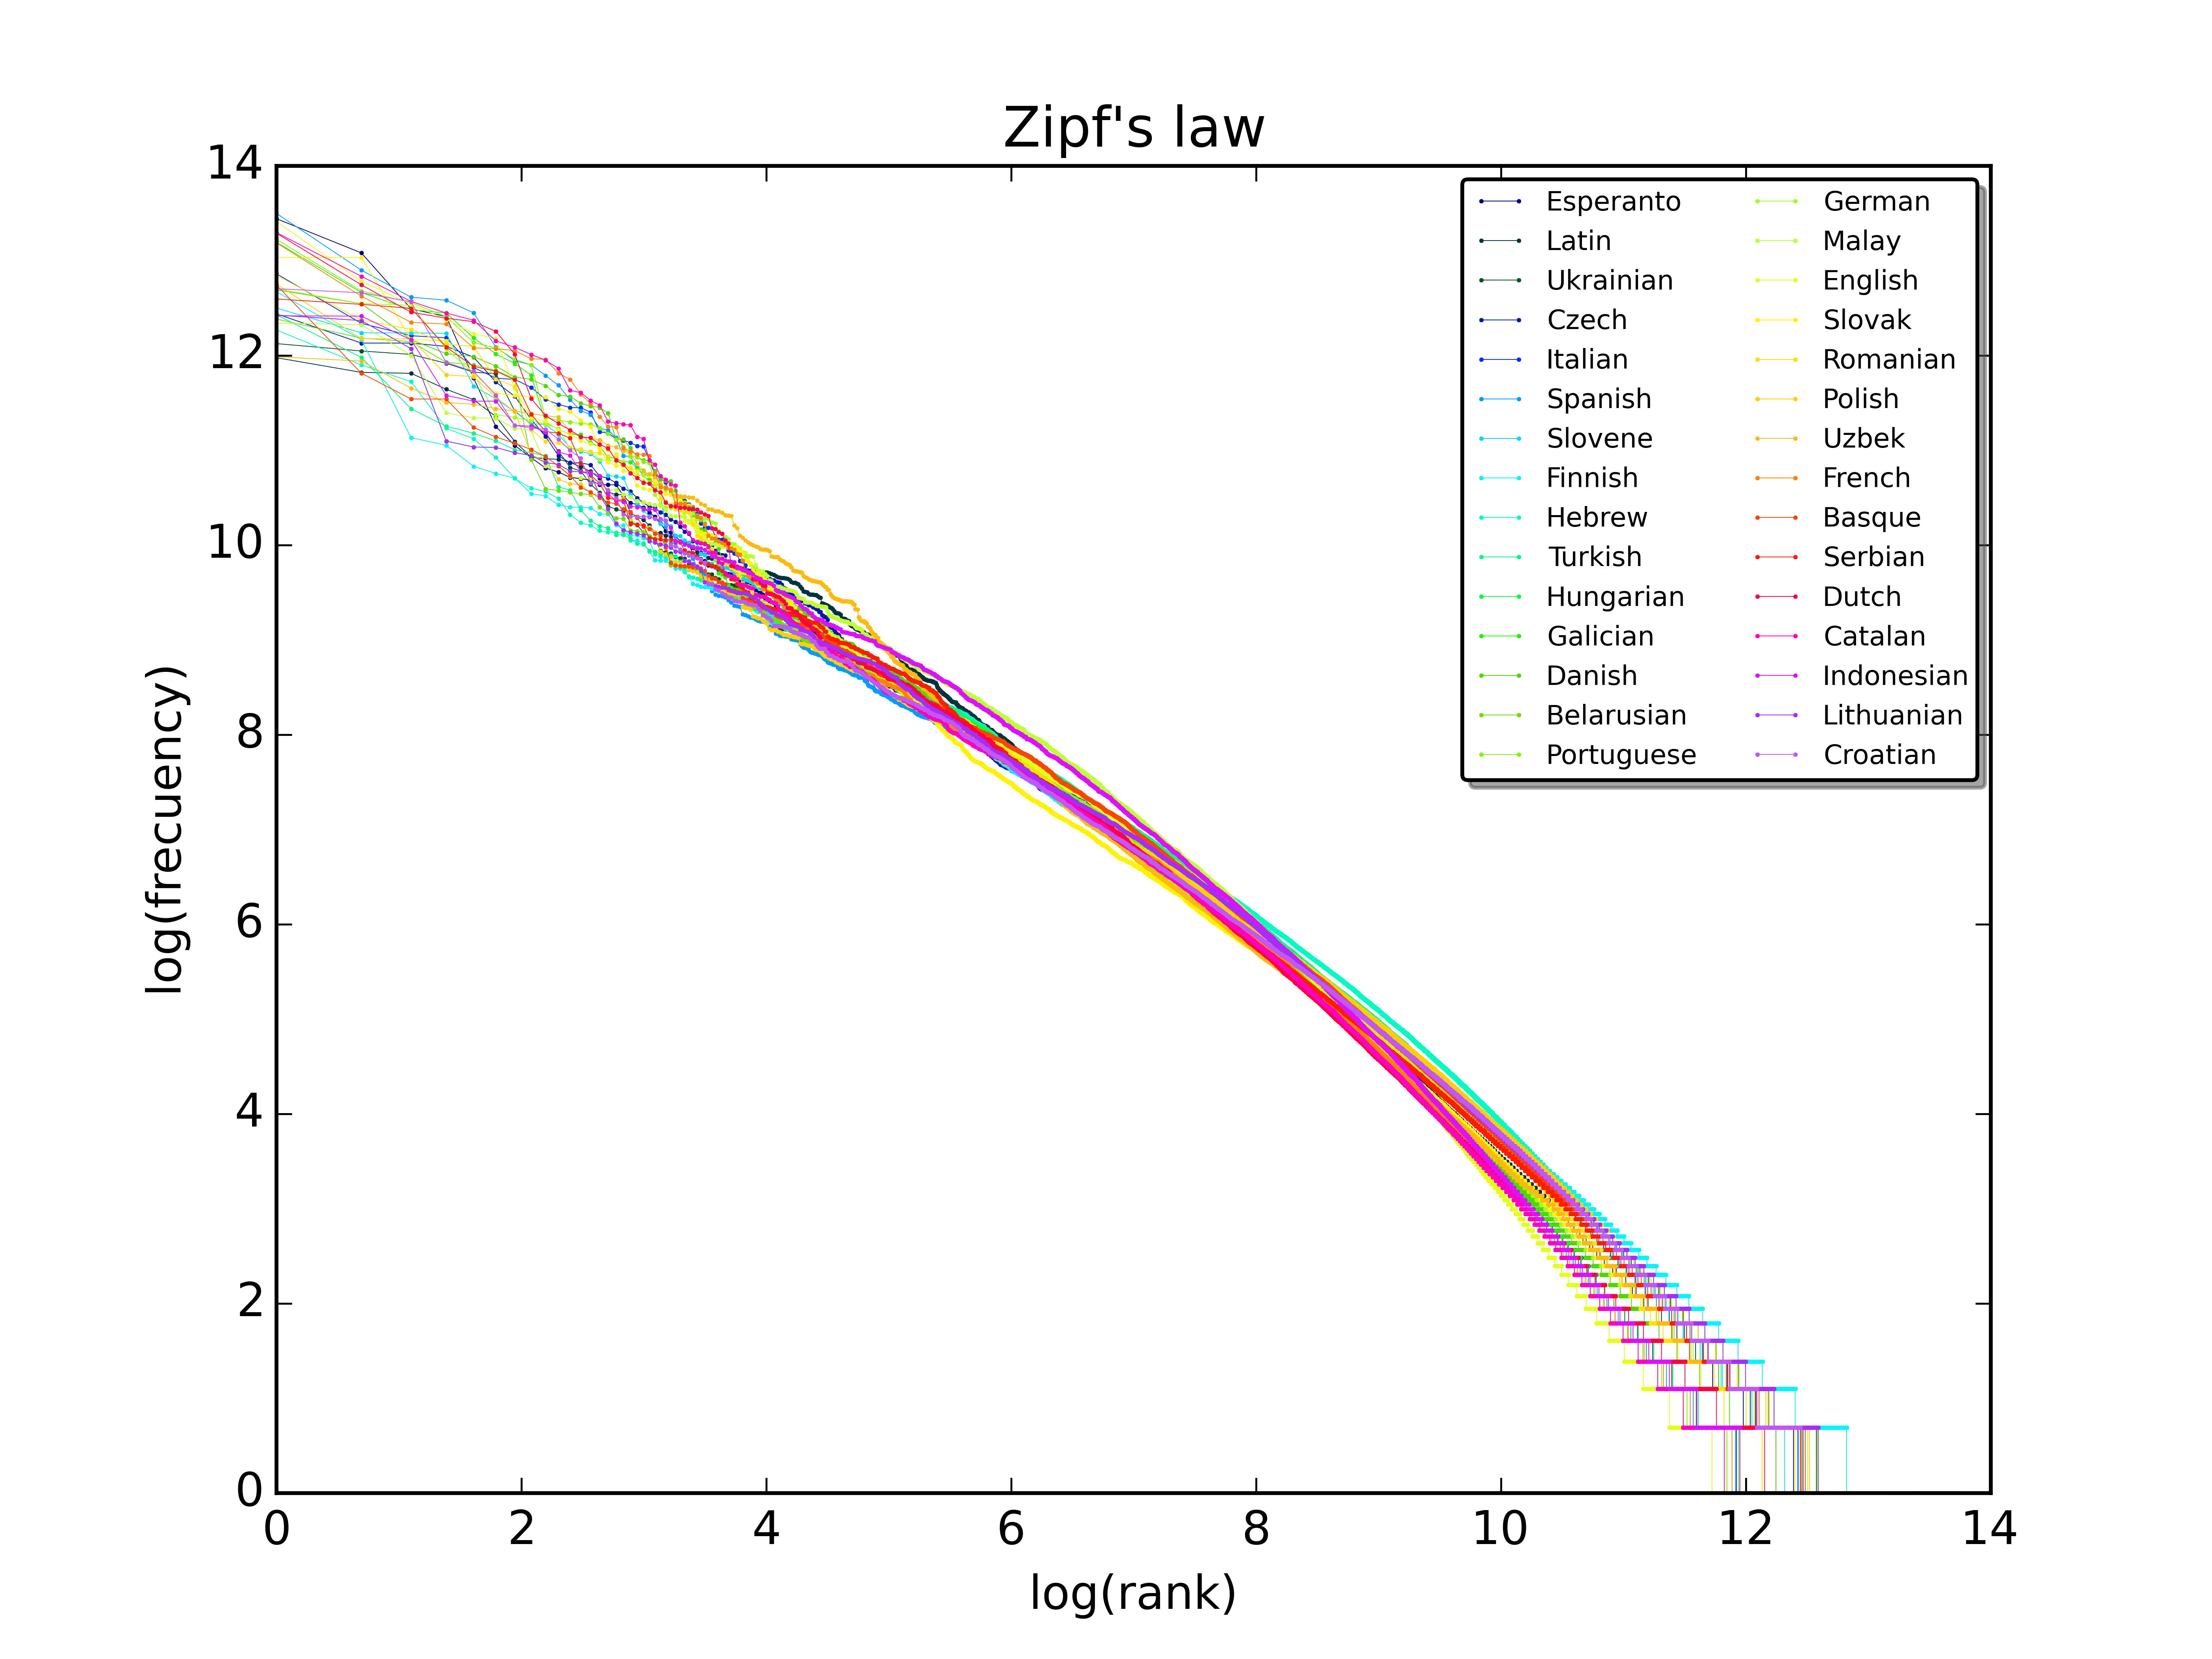
A plot of the rank versus frequency for the first 10
million words in 30 different languages of Wikipedia. Note
the logarithmic scales.
Licensed CC-BY-SA by SergioJimenez.
At almost exactly the same time as Benford was looking at first leading digits, George Kingsley Zipf was studying languages at Harvard. Uniquely, George was applying the techniques of a new and interesting field - statistics - to the study of language. This landed him an astonishing insight: in nearly every language, some words are used a lot, but most (nearly all) words are used hardly at all.
Only a few words account for most of our use of language. The Brown Corpus is a collection of literature used by linguistics researchers. It consists of 500 samples of English-language text comprising 1 million words. Just 135 unique words are needed to account for 50% of those million words. That’s insane.
Zipf’s probability distribution is discrete. Discrete distributions are comprised of whole integers. Continuous distributions can take on any value. If you take Zipf’s distribution and make it continuous instead of discrete, you get the Pareto distribution.
Pareto - the economist #
Pareto initially noticed a curious distribution when he was thinking about wealth in society - he noticed that 80% of the wealth and income came from 20% of the people in it.
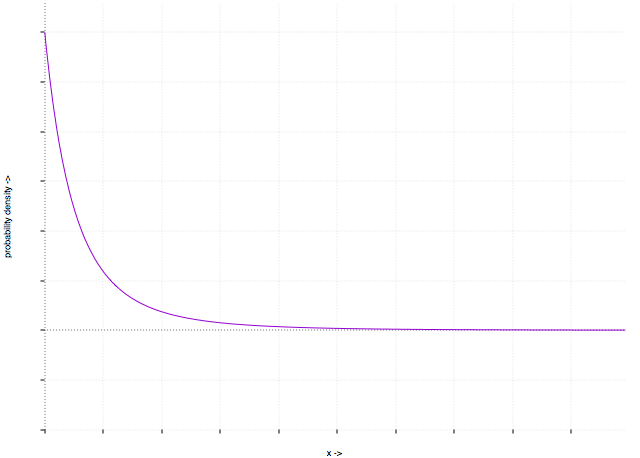
The Pareto distribution, pictured, has been found to hold for a scary number of completely different and unrelated fields in the sciences. For example, here are some natural phenomena that exhibit a Pareto (power law) distribution:
- Wealth inequality
- Sizes of rocks on a beach
- Hard disk drive error rates (!)
- File size distribution of Internet traffic (!!!)
We tend to think of the natural world as random or chaotic. In schools, we’re taught the bell curve/normal distribution. But reality isn’t normally distributed. It’s log-normal. Many probability distributions, in the wild, support the Pareto Principle:
80% of the output will come from 20% of the input

Normal distributions are taught in schools because
they’re quite easy to talk about mathematically, not because
they’re particularly good descriptions of the natural
world.
While you may have heard this before, what I’m trying to get across to you is that it isn’t made up. The Pareto distribution is used in hundreds of otherwise completely unrelated scientific fields - and we can use its ubiquity to our advantage.
It doesn’t matter what area you’re working in - if you’re applying equal effort to all areas, you are wasting your time. What the Pareto distribution shows us is that most of the time, our efforts would be better spent finding and identifying the crucial 20% that accounts for 80% of the output.
Allow me to reformulate and apply this to web application performance:
80% of an application’s work occurs in 20% of its code.
There are other applications in our performance realm too:
80% of an application’s traffic will come from 20% of its features.
80% of an application’s memory usage will come from 20% of its allocated objects.
The ratio isn’t always 80/20. Actually, usually it’s way more severe - 90/10, 95/5, 99/1. Sometimes it’s less severe. So long as it isn’t 50/50 we’re talking about a non-normal distribution.
This is why premature optimization is so bad and why performance monitoring, profiling and benchmarking are so important. The world is full of power-law distributions, not normal distributions. Spreading your effort evenly across a power-law distribution is a massive waste of effort.
What the Pareto Principle reveals to us is that optimizing any random line of code in our application is in fact unlikely to speed up our application at all! 80% of the “slowness” in any given app will be hidden away in a minority of the code.

So instead of optimizing blindly, applying principles at random that we read from blog posts, or engaging in Hacker-News-Driven-Development by using the latest and “most performant” web technologies, we need to measure where the bottlenecks and problem areas are in our application.
An Optimization Story - Measurement, Profiling and Benchmarking #
There’s only one skill in performance work that you need to understand completely and deeply - how to measure your application’s performance. Once you have that skill mastered, knowing every possible thing about performance might be a waste of time. Your problems are not other’s problems. There are going to be lessons to learn that solve problems you don’t have (or don’t comprise that crucial 20% of the causes of slowness in your application).
On the flip side, you should realize that the Pareto Principle is extremely liberating. You don’t need to fix every performance issue in your application. You don’t need to go line-by-line to look for problems under every rock. You need to measure the actual performance of your application, and focus on the 20% of your code that is the worst performance offender.

My first conference talk ever, actually.
I once gave a conference talk that was a guided read-through of Minitest, the Ruby testing framework. Minitest is a great read if you’ve got a spare hour or two - it’s fairly short at just 1,500 lines. As I was reading Minitest’s code, I came across this funny line:
def self.runnable_methods
  methods = methods_matching(/^test_/)

  case self.test_order
  when :random, :parallel then
    max = methods.size
    methods.sort.sort_by { rand max }
  when :alpha, :sorted then
    methods.sort
  else
    raise "Unknown test_order: #{self.test_order.inspect}"
  end
end
This code is extremely readable as to what’s going on; we
determine which methods on a class are runnable with a regex
(“starts with test_”), and then sort them depending upon this
test class’s
test_order. Minitest uses the return value to execute all of the
runnable_methods
on all the test classes you give it. Usually this is a
randomized array of method names, because the default test
order is
:random.
What I was honing in on was this line, which is run when
:test_order
is
:random
or
:parallel:
max = methods.size
methods.sort.sort_by { rand max }
This seemed like a really roundabout way to do
methods.shuffle
to me. Maybe Ryan (Minitest’s author) was doing some weird
thing to ensure deterministic execution given a seed. Minitest
runs your tests in the same order given the same seed to the
random number generator. It turns out methods.shuffle is
deterministic, though, just like the code as written. So, I
decided to benchmark it, mostly out of curiosity.
Whenever I need to write a micro benchmark of Ruby code, I
reach for
benchmark/ips.1
(The reason I use benchmark/ips rather than the stdlib
benchmark is because the stdlib version requires you to run
a certain line of code X number of times and tells you how
long that took. The problem with that is that I don’t
usually know how fast the code is to begin with, so I have
no idea how to set X. Usually I run the code a few times,
guess at a number of X that will make the benchmark take 10
seconds to run, and then move on. benchmark/ips does that
work for me by running my benchmark for 10 seconds and
calculating iterations-per-second.)1 The reason I use
benchmark/ips rather than the stdlib benchmark is because
the stdlib version requires you to run a certain line of
code X number of times and tells you how long that took. The
problem with that is that I don’t usually know how fast the
code is to begin with, so I have no idea how to set X.
Usually I run the code a few times, guess at a number of X
that will make the benchmark take 10 seconds to run, and
then move on. benchmark/ips does that work for me by running
my benchmark for 10 seconds and calculating
iterations-per-second.
ips
stands for iterations-per-second. The gem is an extension of
the
Benchmark
module, something we get in the Ruby stdlib.
Here’s that benchmark:
require "benchmark/ips"

class TestBench
  def methods
    @methods ||= ("a".."z").to_a
  end

  def fast
    methods.shuffle
  end

  def slow
    max = methods.size
    methods.sort.sort_by { rand max }
  end
end

test = TestBench.new

Benchmark.ips do |x|
  x.report("faster alternative") { test.fast }
  x.report("current minitest code") { test.slow }
  x.compare!
end
This benchmark suggested that
shuffle
was 12x faster than
sort.sort_by { rand methods.size }. This makes sense -
shuffle
randomizes the array with C, which will always be faster than
randomizing it with pure Ruby. In addition, Ryan was actually
sorting the array twice - once in alphabetical order, followed
by a random shuffle based on the output of
rand.

Ryan’s conference talks
are pretty good, too.
I asked Ryan Davis,
minitest
author, what was up with this. He gave me a great reply: “you
benchmarked it, but did you profile it?”
What did he mean by this? Well, first, you have to know the difference between benchmarking and profiling - the two fundamental performance measurement tools.
There are a lot of different ways to define this difference. Here’s my attempt:
Benchmarking #
A benchmark is a test of one or many different pieces of code that measures how fast they execute or how many resources they consume.
When we benchmark, we take two competing pieces of code and compare them. It could be as simple as a one liner, like in my story, or as complex as an entire web framework. Then, we put them up against each other (usually comparing them in terms of iterations/second) using a simple, contrived task. At the end of the task, we come up with a single metric - a score. We use the score to compare the two competing options.
In my example above, it was just how fast each line could shuffle an array. If you were benchmarking web frameworks, you might test how fast a framework can return a simple “Hello World” response. Benchmarks put the competing alternatives on exactly equal footing by coming up with a contrived, simple, non-real-world example.
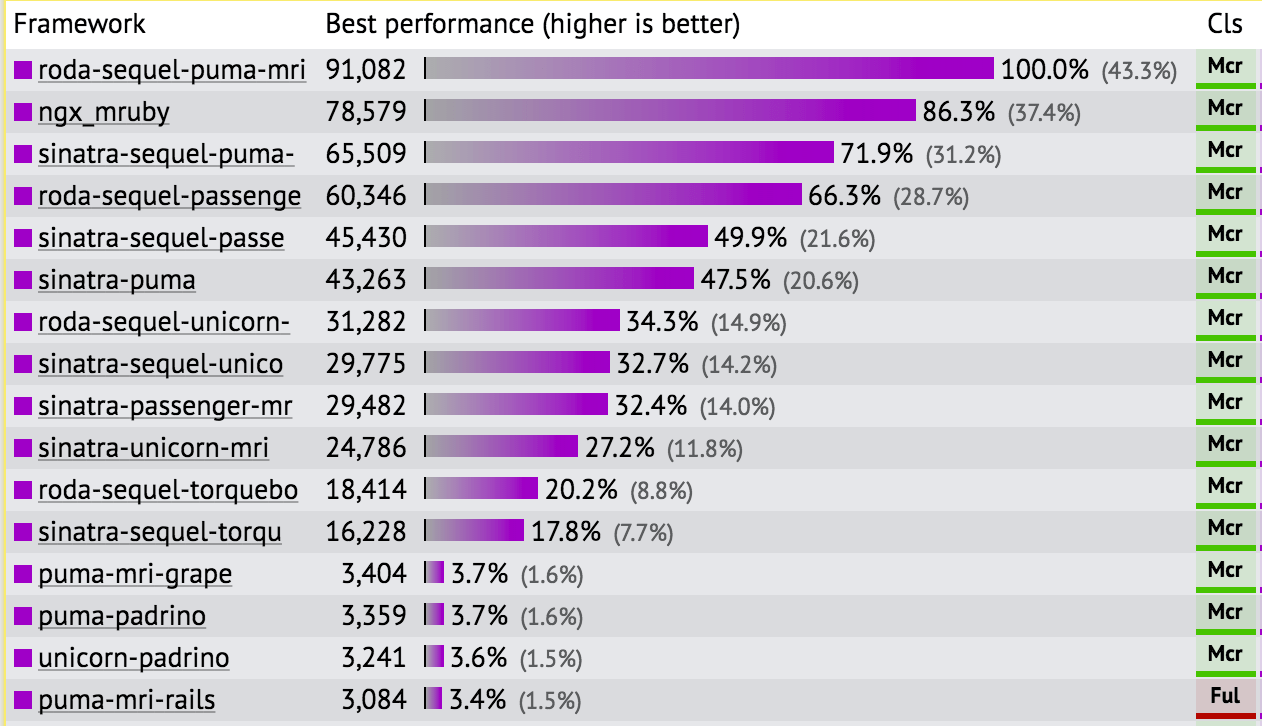
I wrote a v v long post once about why this benchmark
doesn’t mean much for Rails
It’s usually too difficult to benchmark real-world code because the alternatives aren’t doing exactly the same thing. For example, comparing Rails against Sinatra isn’t entirely fair because Rails has many features that Sinatra does not - even for a simple Hello World response, the Rails application is, for example, performing many security checks that the Sinatra app doesn’t. Comparing these frameworks in a 1-to-1 benchmark will always be slightly misleading for that reason.
Profiling #
Profiles are a accounting of all the sub-steps required to run a given piece of code. When we profile, we’re usually examining the performance characteristics of an entire, real-world application. For example, this might be a web application or a test suite. Because profiling works with real-world code, we can’t really use it to compare competing alternatives, because the alternative usually doesn’t exactly match what we’re profiling. Profiling doesn’t usually produce a comparable “score” at the end with which to measure these alternatives, either. But that’s not to say profiling is useless - it can tell us a lot of valuable things, like what percentage of CPU time was used where, where memory was allocated, and what lines of code are important and which ones aren’t.
What Ryan was asking me was - “Yeah, that way is faster on this one line, but does it really matter in the grand scheme of Minitest”? How much time does a Minitest test run actually spend shuffling the methods? 1%? 10%? 0.001%? Profiling can tells us that.

You said that this one-line change would speed up
minitest. A higher-level benchmark determined
that was a lie.
Is this one line really part of Pareto’s “20%”? We can assume, based on the Principle, that 80% of Minitest’s execution time will come from just 20% of its code. Was this line part of that 20%?
I’ve already shown you how to benchmark on the micro scale.
But before we get to profiling, I’m going to do a quick
macro-benchmark to test my assumption that using
shuffle
instead of
sort.sort_by
will speed up Minitest.
Minitest is used to run tests, so we’re going to benchmark a whole test suite. Rubygems.org, an open-source Rails application with a Minitest suite, will make a good example test suite.
When micro-benchmarking, I reach for
benchmark-ips. When macro-benchmarking (and especially in this case, with
a test suite), I usually reach first for the simplest tool
available: the unix utility
time! We’re going to run the tests 10 times, and then divide the
total time by 10.
$ time for i in {1..10}; do bundle exec rake; done

...

real	15m59.384s
user	11m39.100s
sys	1m15.767s
When using
time, we’re usually only going to pay attention the
user
statistic.
real
gives the actual total time (as if you had used a stopwatch),
sys
gives the time spent in the kernel (in a test run, this would
be things like shelling out to I/O), and
user
will be the closest approximation to time actually spent
running Ruby. You’ll notice that
user
and
sys
don’t add up to
real
- the difference is time spent waiting on the CPU while other
operations (like running my web browser, etc) block.
With stock
minitest, the whole thing takes 11 minutes and 39 seconds, for an
average of 69.9 seconds per run. Now, let’s alter the Gemfile
to point to a modified version (with
shuffle
on the line in question) of
minitest
on my local machine:
gem 'minitest', require: false, path: '../minitest'
To make sure the test is 100% fair, I only make the change to
my local version after I check out
minitest
to the same version that Rubygems.org is running (5.8.1).

Even so-called performance experts mess this shit up
sometimes.
The result? 11 minutes 56 seconds. Longer than the original test! We know my code is faster in micro, but the macro benchmark told me that it actually takes longer. A lot of things can cause this (the most likely being other stuff running on my machine), but what’s clear is this - my little patch doesn’t seem to be making a big difference to the big picture of someone’s test suite. While making this change would, in theory, speed up someone’s suite, in reality, the impact is so minuscule that it didn’t really matter.
So, while a benchmark told me one thing - X is 10x faster than Y! - a higher-level benchmark told me another (make your change and this thing didn’t really matter.) Not only does this show the value of profiling (which would have told me before that the sorting didn’t take much of the total time) but also how microbenchmarks and relative comparisons can mislead.
Performance measurement is a critical skill. Anywhere along the way, I could have been mislead by a single number or a rogue measurement. By applying a scientific, empirical approach, I was able to put my benchmark in context of a larger program.
Premature optimization is ignoring these lessons and optimizing “when we feel like it”, or optimizing constantly all the time. Hopefully I’ve convinced you: it’s a guaranteed waste of time.
Repeat after me: I will not optimize anything in my application until my metrics tell me so.
Want a faster website?
I'm Nate Berkopec (@nateberkopec). I write online about web performance from a full-stack developer's perspective. I primarily write about frontend performance and Ruby backends. If you liked this article and want to hear about the next one, click below. I don't spam - you'll receive about 1 email per week. It's all low-key, straight from me.
Products from Speedshop
The Complete Guide to Rails Performance is a full-stack performance book that gives you the tools to make Ruby on Rails applications faster, more scalable, and simpler to maintain.
Learn more
More Posts
Organization for Transformative Works Performance Audit
A Rails performance audit report for the Organization for Transformative Works and Archive of Our Own.
Announcing the Rails Performance Apocrypha
I've written a new book, compiled from 4 years of my email newsletter.
We Made Puma Faster With Sleep Sort
Puma 5 is a huge major release for the project. It brings several new experimental performance features, along with tons of bugfixes and features. Let's talk about some of the most important ones.
The Practical Effects of the GVL on Scaling in Ruby
MRI Ruby's Global VM Lock: frequently mislabeled, misunderstood and maligned. Does the GVL mean that Ruby has no concurrency story or CaN'T sCaLe? To understand completely, we have to dig through Ruby's Virtual Machine, queueing theory and Amdahl's Law. Sounds simple, right?