Understanding Ruby GC through GC.stat

I call that an object leak.
Most Ruby programmers don’t have any idea how garbage
collection works in their runtime - what triggers it, how
often it runs, and what is garbage collected and what isn’t.
That’s not entirely a bad thing - garbage collection in
dynamic languages like Ruby is usually pretty complex, and
Ruby programmers are better off just focusing on writing code
that matters for their users.
But, occasionally, you get bitten by GC - either it’s running too often or not enough, or your process is using tons of memory but you don’t know why. Or maybe you’re just curious about how GC works!
One way we can learn a bit about garbage collection in CRuby
(that is, the standard Ruby runtime, written in C) is to look
at the built-in
GC
module. If you haven’t
read the docs
of this module, check it out. There’s a lot of interesting
methods in there. But for right now, we’re just going to look
at one:
GC.stat.

Me, reading MRI source.
GC.stat
outputs a hash with a bunch of different numbers, but none of
these numbers are really well documented, and some are just
completely confusing unless you actually read the C code for
Ruby’s GC! Rather than having you do that yourself, I’ve done
it for you. Let’s take a look at all the information in
GC.stat
and see what we can learn about GC in Ruby.
Here’s what my
GC.stat
looks like in a just-booted
irb
session using Ruby 2.4.0:
{
  :count=>15,
  :heap_allocated_pages=>63,
  :heap_sorted_length=>63,
  :heap_allocatable_pages=>0,
  :heap_available_slots=>25679,
  :heap_live_slots=>25506,
  :heap_free_slots=>173,
  :heap_final_slots=>0,
  :heap_marked_slots=>17773,
  :heap_eden_pages=>63,
  :heap_tomb_pages=>0,
  :total_allocated_pages=>63,
  :total_freed_pages=>0,
  :total_allocated_objects=>133299,
  :total_freed_objects=>107793,
  :malloc_increase_bytes=>45712,
  :malloc_increase_bytes_limit=>16777216,
  :minor_gc_count=>13,
  :major_gc_count=>2,
  :remembered_wb_unprotected_objects=>182,
  :remembered_wb_unprotected_objects_limit=>352,
  :old_objects=>17221,
  :old_objects_limit=>29670,
  :oldmalloc_increase_bytes=>46160,
  :oldmalloc_increase_bytes_limit=>16777216
}
Ok, there’s a lot there. That’s 25 undocumented keys! Yay!
First, let’s talk about the GC counts:
{
  :count=>15,
  # ...
  :minor_gc_count=>13,
  :major_gc_count=>2
}
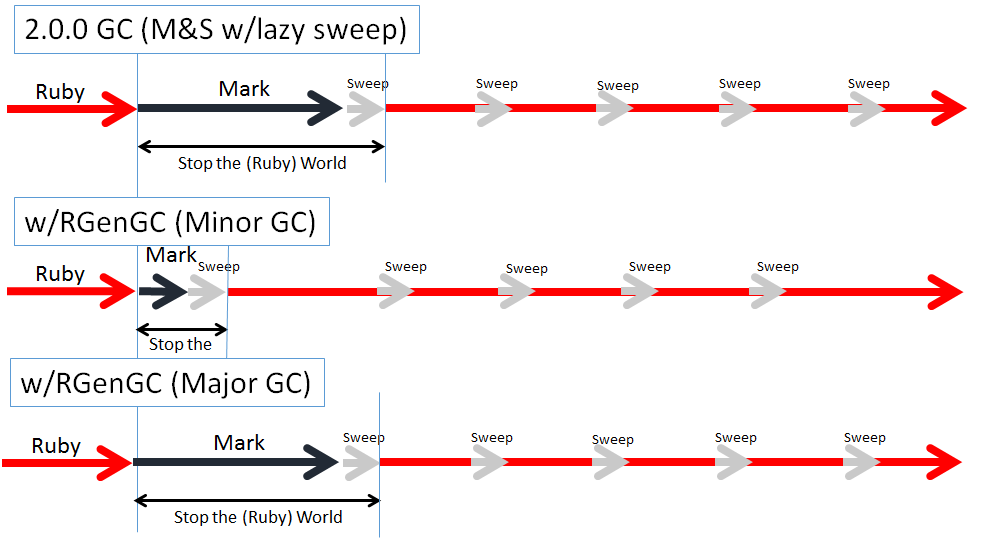
RGenGC, introduced in Ruby 2.1.
Slide from Koichi Sasada.
These are pretty straightforward.
minor_gc_count
and
major_gc_count
are just counts of each type of GC since the start of this
Ruby process. In case you didn’t know, since Ruby 2.1 there
have been two types of garbage collections, major and
minor. A minor GC will only attempt to garbage collect objects
which are “new” - that is, they have survived 3 or less
garbage collection cycles. A major GC will attempt to garbage
collect all objects, even ones which have already
survived more than 3 GC cycles.
count
will always equal
minor_gc_count
+
major_gc_count. For more about this, see my talk at FOSDEM about
the history of Ruby Garbage Collection.
Tracking GC counts can be useful for a few reasons. We can figure out if a particular background job, for example, always triggers GCs (and how many it triggers). For example, here’s a Rack middleware that logs the number of GCs that occurred while a web request was processing:
class GCCounter
  def initialize(app)
    @app = app
  end

  def call(env)
    gc_counts_before = GC.stat.select { |k,v| k =~ /count/ }
    @app.call(env)
    gc_counts_after = GC.stat.select { |k,v| k =~ /count/ }
    puts gc_counts_before.merge(gc_counts_after) { |k, vb, va| va - vb }
  end
end
This won’t be 100% accurate if your application is multithreaded, because another thread executing may have actually created the memory pressure which triggered these GC’s, but it’s a starting point!
Now, let’s move on to the heap numbers.
{
  # Page numbers
  :heap_allocated_pages=>63,
  :heap_sorted_length=>63,
  :heap_allocatable_pages=>0,

  # Slots
  :heap_available_slots=>25679,
  :heap_live_slots=>25506,
  :heap_free_slots=>173,
  :heap_final_slots=>0,
  :heap_marked_slots=>17773,

  # Eden and Tomb
  :heap_eden_pages=>63,
  :heap_tomb_pages=>0
}
In this context, the
heap
is a C data structure, sometimes also called the
ObjectSpace, in which we keep references to of all the currently live
Ruby objects. On a 64-bit system, each heap
page contains approximately 408 slots. Each
slot contains information about a single live Ruby object.
First, you’ve got some information about the overall size of
the entire Ruby object space.
heap_allocated_pages
is just the number of currently allocated heap pages (er,
duh). These pages may be completely empty, completely full, or
somewhere in between.
heap_sorted_length
is the actual size of the heap in memory - if we have 10 heap
pages, and then free the 5th page (or some other random page
from the middle), the length of the heap is still 10
pages (since we cannot move pages around in memory).
heap_sorted_length
will always be greater than or equal to the number of actually
allocated pages. Finally, we’ve got
heap_allocatable_pages
- these are heap-page-sized chunks of memory that Ruby
currently owns (i.e., has already
malloced) that we could allocate a new heap page in. If Ruby needs
a new heap page for additional objects, it will use this
memory space first.
Okay, now we’ve got a lot of numbers relating to the
individual object
slots.
heap_available_slots
is obviously the total number of slots in heap pages -
GC.stat[:heap_available_slots]
divided by
GC::INTERNAL_CONSTANTS[:HEAP_PAGE_OBJ_LIMIT]
will always equal
GC.stat[:heap_allocated_pages].
heap_live_slots
is the number of live objects, and
heap_free_slots
are slots in heap pages which are empty.
heap_final_slots
are object slots which have finalizers attached to
them. Finalizers are sort of an obscure feature of Ruby -
they’re just Procs which run when an object is freed. Here’s
an example:
ObjectSpace.define_finalizer(self, self.class.method(:finalize).to_proc)
heap_marked_slots
are pretty much the count of old objects (objects
that have survived more than 3 GC cycles) plus
write barrier unprotected objects, which we’re going
to get to a minute.
As for practical use of the slot counts in
GC.stat, I’d suggest monitoring
heap_free_slots
if you’re having memory bloat issues. Large numbers of free
slots (like more than 300,000) usually indicates that you have
a few controller actions which are allocating large numbers of
objects and then freeing them, which can permanently bloat the
size of your Ruby process. For more about fixing that,
check out my Rubyconf talk of memory issues in Ruby.

WELCOME TO THE TOMB PAGES
Now we’ve got
tomb_pages
and
eden_pages. Eden pages are heap pages which contain
at least one live object in them. Tomb pages
contain no live objects, and so have completely free
slots. The Ruby runtime can
only release tomb pages back to the operating system,
eden pages can never be freed.
Briefly, there are a few cumulative allocated/freed numbers.
{
  :total_allocated_pages=>63,
  :total_freed_pages=>0,
  :total_allocated_objects=>133299,
  :total_freed_objects=>107793
}
These numbers are cumulative for the life of the process - they are never reset and will not go down. They’re pretty self explanatory.
Finally, we have the garbage collection thresholds.
{
  :malloc_increase_bytes=>45712,
  :malloc_increase_bytes_limit=>16777216,
  :remembered_wb_unprotected_objects=>182,
  :remembered_wb_unprotected_objects_limit=>352,
  :old_objects=>17221,
  :old_objects_limit=>29670,
  :oldmalloc_increase_bytes=>46160,
  :oldmalloc_increase_bytes_limit=>16777216
}
So, one major misconception Ruby developers have is about
when garbage collection is triggered. We can trigger
GCs manually with
GC.start, but that doesn’t happen in production. Many seem to think
that GC runs on some sort of timer - every X seconds or
requests. That’s not true.
Minor GCs are triggered by a lack of free slots. Ruby doesn’t
automatically GC anything - it only GCs when it runs out of
space. So when there are no
free_slots
left, we run a minor GC - marking and sweeping all of the
“new” (i.e. not old, have survived fewer than 3 GCs) objects
and objects in the remember set and those which are
not protected by the write-barrier. I’ll define those
terms in a second.
Major GCs can be triggered by a lack of free slots
after a minor GC, or any of the following 4
thresholds being exceeded: oldmalloc, malloc, old object
count, or the “shady”/writebarrier-unprotected count. The part
of GC.stat we’re looking at here shows each of those four
thresholds (the
limit) and the current state of the runtime on the way to that
threshold.
malloc_increase_bytes
refers to when Ruby allocates space for objects
outside of the “heap” we’ve been discussing so far.
Each object slot in the heap pages is only 40 bytes (see
GC::INTERNAL_CONSTANTS[:RVALUE_SIZE]) so what happens when we have an object larger than 40 bytes
(say, a long string)? We
malloc
some space just for that object somewhere else! If we allocate
80 bytes for a string, for example,
malloc_increase_bytes
will increase by 80. When this number reaches the limit, we
trigger a major GC.
oldmalloc_increase_bytes
is the same thing, but only includes objects that are
old.
remembered_wb_unprotected_objects
is a count of objects which are not protected by the
write-barrier and are part of the
remembered set. Let’s define both of those terms. The
write-barrier is simply a interface between the Ruby runtime
and an object, so that we can track references to and from the
object when they’re created. C-extensions can create new
references to objects without going through the write-barrier,
so objects which have been touched by C-extensions are called
“shady” or “write-barrier unprotected”. The remembered set is
a list of old objects which have a reference to a
new object.
old_objects
is just a count of object slots marked as old.
Tracking these thresholds might be helpful if you’re having trouble with a large number of major GCs.
I hope this has been an educational look at GC.stat - it’s an informative hash which can be used to build temporary debugging solutions for when you’ve got bad GC behavior that you need to fix.
Want a faster website?
I'm Nate Berkopec (@nateberkopec). I write online about web performance from a full-stack developer's perspective. I primarily write about frontend performance and Ruby backends. If you liked this article and want to hear about the next one, click below. I don't spam - you'll receive about 1 email per week. It's all low-key, straight from me.
Products from Speedshop
The Complete Guide to Rails Performance is a full-stack performance book that gives you the tools to make Ruby on Rails applications faster, more scalable, and simpler to maintain.
Learn more
More Posts
Organization for Transformative Works Performance Audit
A Rails performance audit report for the Organization for Transformative Works and Archive of Our Own.
Announcing the Rails Performance Apocrypha
I've written a new book, compiled from 4 years of my email newsletter.
We Made Puma Faster With Sleep Sort
Puma 5 is a huge major release for the project. It brings several new experimental performance features, along with tons of bugfixes and features. Let's talk about some of the most important ones.
The Practical Effects of the GVL on Scaling in Ruby
MRI Ruby's Global VM Lock: frequently mislabeled, misunderstood and maligned. Does the GVL mean that Ruby has no concurrency story or CaN'T sCaLe? To understand completely, we have to dig through Ruby's Virtual Machine, queueing theory and Amdahl's Law. Sounds simple, right?